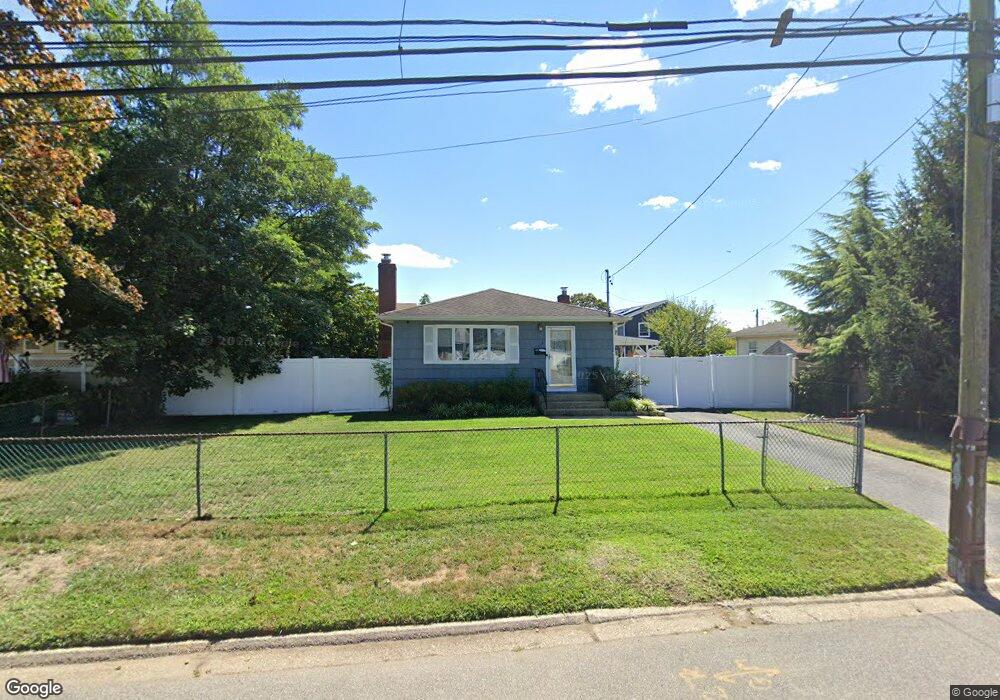
525 7th St West Babylon, NY 11704
Estimated Value: $572,194 - $688,000
Studio
--
Bath
1,000
Sq Ft
$633/Sq Ft
Est. Value
About This Home
This home is located at 525 7th St, West Babylon, NY 11704 and is currently estimated at $632,549, approximately $632 per square foot. 525 7th St is a home located in Suffolk County with nearby schools including West Babylon Senior High School and Bethesda Sda Elementary School.
Ownership History
Date
Name
Owned For
Owner Type
Purchase Details
Closed on
Sep 23, 2011
Sold by
Martin Eric J and Martin Dennis
Bought by
Martin Dennis
Current Estimated Value
Home Financials for this Owner
Home Financials are based on the most recent Mortgage that was taken out on this home.
Original Mortgage
$9,168
Outstanding Balance
$6,275
Interest Rate
4.25%
Mortgage Type
Purchase Money Mortgage
Estimated Equity
$626,274
Purchase Details
Closed on
Mar 27, 2002
Sold by
Pinto Arnaldo J and Pinto Dorothy
Bought by
Martin Eric J and Martin Dennis
Home Financials for this Owner
Home Financials are based on the most recent Mortgage that was taken out on this home.
Original Mortgage
$172,000
Interest Rate
6.85%
Purchase Details
Closed on
Apr 30, 1999
Sold by
Simms Sandra and Simms Lewis
Bought by
Sunderland Mark S
Create a Home Valuation Report for This Property
The Home Valuation Report is an in-depth analysis detailing your home's value as well as a comparison with similar homes in the area
Home Values in the Area
Average Home Value in this Area
Purchase History
| Date | Buyer | Sale Price | Title Company |
|---|---|---|---|
| Martin Dennis | -- | -- | |
| Martin Eric J | $215,000 | Commonwealth Land Title Ins | |
| Sunderland Mark S | $170,000 | First American Title Ins Co |
Source: Public Records
Mortgage History
| Date | Status | Borrower | Loan Amount |
|---|---|---|---|
| Open | Martin Dennis | $9,168 | |
| Previous Owner | Martin Eric J | $172,000 |
Source: Public Records
Tax History
| Year | Tax Paid | Tax Assessment Tax Assessment Total Assessment is a certain percentage of the fair market value that is determined by local assessors to be the total taxable value of land and additions on the property. | Land | Improvement |
|---|---|---|---|---|
| 2024 | $11,000 | $2,830 | $320 | $2,510 |
| 2023 | $11,000 | $2,830 | $320 | $2,510 |
| 2022 | $9,274 | $2,830 | $320 | $2,510 |
| 2021 | $9,274 | $2,830 | $320 | $2,510 |
| 2020 | $9,637 | $2,830 | $320 | $2,510 |
| 2019 | $9,637 | $0 | $0 | $0 |
| 2018 | $9,186 | $2,830 | $320 | $2,510 |
| 2017 | $9,186 | $2,830 | $320 | $2,510 |
| 2016 | $9,201 | $2,830 | $320 | $2,510 |
| 2015 | -- | $2,830 | $320 | $2,510 |
| 2014 | -- | $2,830 | $320 | $2,510 |
Source: Public Records
Map
Nearby Homes
Your Personal Tour Guide
Ask me questions while you tour the home.