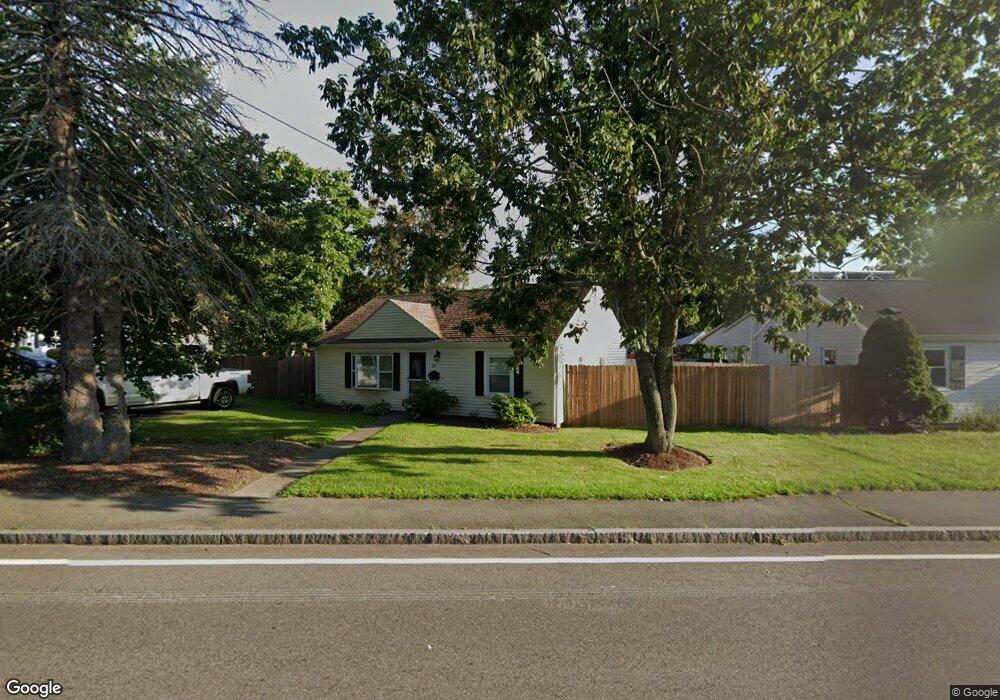
525 E Ashland St Brockton, MA 02302
Estimated Value: $374,735 - $418,000
2
Beds
1
Bath
828
Sq Ft
$490/Sq Ft
Est. Value
About This Home
This home is located at 525 E Ashland St, Brockton, MA 02302 and is currently estimated at $405,434, approximately $489 per square foot. 525 E Ashland St is a home located in Plymouth County with nearby schools including Brookfield Elementary School, Mary E. Baker Elementary School, and Downey Elementary School.
Ownership History
Date
Name
Owned For
Owner Type
Purchase Details
Closed on
Nov 5, 2021
Sold by
Burr Brian C and Burr Kimberly
Bought by
Clark Kyle P and Clark Heather C
Current Estimated Value
Home Financials for this Owner
Home Financials are based on the most recent Mortgage that was taken out on this home.
Original Mortgage
$289,750
Outstanding Balance
$265,098
Interest Rate
2.88%
Mortgage Type
Purchase Money Mortgage
Estimated Equity
$140,336
Purchase Details
Closed on
May 15, 2002
Sold by
Scully Henry G
Bought by
Burr Brian C and Burr Kimberly M
Purchase Details
Closed on
Dec 24, 1998
Sold by
Mayland Rt
Bought by
Scully Henry G
Purchase Details
Closed on
May 12, 1998
Sold by
Duggan Thomas X
Bought by
Mayland Rt
Purchase Details
Closed on
Mar 19, 1998
Sold by
Dragunas Victor R and Dragunas George
Bought by
Duggan Thomas X
Create a Home Valuation Report for This Property
The Home Valuation Report is an in-depth analysis detailing your home's value as well as a comparison with similar homes in the area
Purchase History
| Date | Buyer | Sale Price | Title Company |
|---|---|---|---|
| Clark Kyle P | $305,000 | None Available | |
| Burr Brian C | $131,000 | -- | |
| Scully Henry G | $64,000 | -- | |
| Mayland Rt | $48,000 | -- | |
| Duggan Thomas X | $24,339 | -- |
Source: Public Records
Mortgage History
| Date | Status | Borrower | Loan Amount |
|---|---|---|---|
| Open | Clark Kyle P | $289,750 | |
| Previous Owner | Duggan Thomas X | $245,500 | |
| Previous Owner | Duggan Thomas X | $15,992 |
Source: Public Records
Tax History
| Year | Tax Paid | Tax Assessment Tax Assessment Total Assessment is a certain percentage of the fair market value that is determined by local assessors to be the total taxable value of land and additions on the property. | Land | Improvement |
|---|---|---|---|---|
| 2025 | $3,993 | $329,700 | $143,800 | $185,900 |
| 2024 | $3,938 | $327,600 | $143,800 | $183,800 |
| 2023 | $4,000 | $308,200 | $108,500 | $199,700 |
| 2022 | $3,798 | $271,900 | $98,500 | $173,400 |
| 2021 | $3,740 | $257,900 | $90,500 | $167,400 |
| 2020 | $3,478 | $229,600 | $87,000 | $142,600 |
| 2019 | $3,332 | $214,400 | $80,200 | $134,200 |
| 2018 | $2,552 | $186,200 | $80,200 | $106,000 |
| 2017 | $2,552 | $158,500 | $80,200 | $78,300 |
| 2016 | $2,502 | $144,100 | $76,500 | $67,600 |
| 2015 | $2,169 | $119,500 | $76,500 | $43,000 |
| 2014 | $1,967 | $108,500 | $76,500 | $32,000 |
Source: Public Records
Map
Nearby Homes
- 521 E Ashland St
- 116 Cairn Rd
- 524 E Ashland St
- 537 E Ashland St
- 513 E Ashland St
- 129 Bradley Ave
- 117 Cairn Rd
- 110 Cairn Rd
- 518 E Ashland St
- 534 E Ashland St
- 512 E Ashland St
- 111 Cairn Rd
- 123 Bradley Ave
- 543 E Ashland St
- 100 Massachusetts Ave
- 100 Massachusetts Ave
- 105 Cairn Rd
- 108 Massachusetts Ave
- 542 E Ashland St
- 505 E Ashland St
Your Personal Tour Guide
Ask me questions while you tour the home.