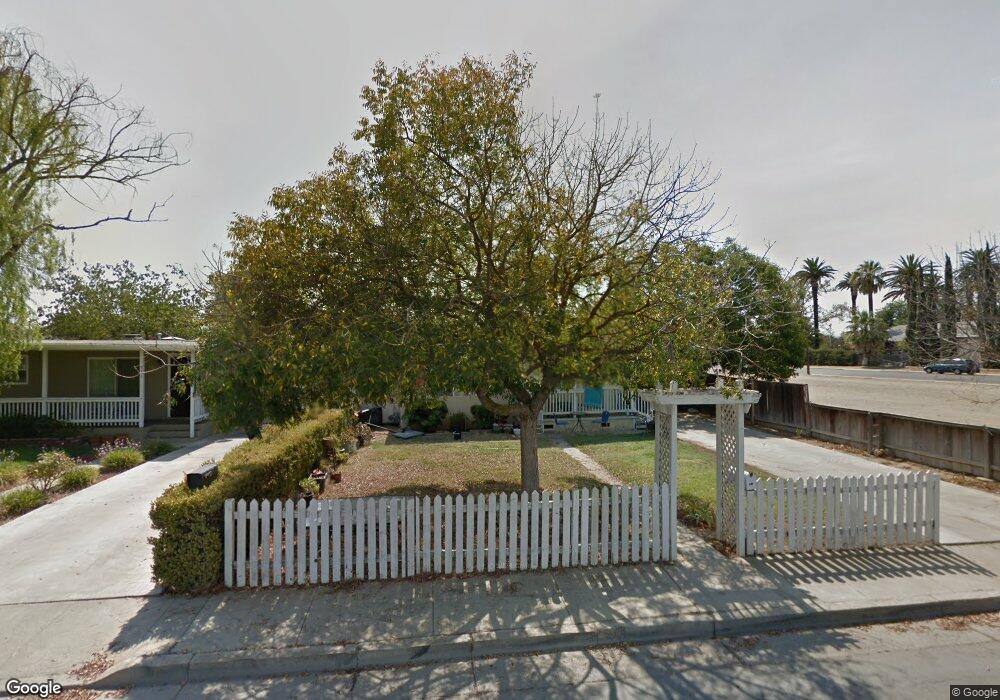
525 E St Los Banos, CA 93635
Estimated Value: $244,000 - $308,000
2
Beds
1
Bath
672
Sq Ft
$408/Sq Ft
Est. Value
About This Home
This home is located at 525 E St, Los Banos, CA 93635 and is currently estimated at $273,953, approximately $407 per square foot. 525 E St is a home located in Merced County with nearby schools including Los Banos Elementary School, Creekside Junior High School, and Los Banos High School.
Ownership History
Date
Name
Owned For
Owner Type
Purchase Details
Closed on
May 12, 2023
Sold by
Sauber Alice D
Bought by
Parra Stephanie Ray
Current Estimated Value
Home Financials for this Owner
Home Financials are based on the most recent Mortgage that was taken out on this home.
Original Mortgage
$220,924
Outstanding Balance
$214,657
Interest Rate
6.28%
Mortgage Type
FHA
Estimated Equity
$59,296
Purchase Details
Closed on
Apr 11, 2023
Sold by
Hunt Franklin David and Hunt Marie Antoinette
Bought by
Sauber Alice D
Home Financials for this Owner
Home Financials are based on the most recent Mortgage that was taken out on this home.
Original Mortgage
$220,924
Outstanding Balance
$214,657
Interest Rate
6.28%
Mortgage Type
FHA
Estimated Equity
$59,296
Purchase Details
Closed on
Jan 21, 2015
Sold by
Sauber Alice D
Bought by
Sauber Alice D and Hunt Franklin David
Create a Home Valuation Report for This Property
The Home Valuation Report is an in-depth analysis detailing your home's value as well as a comparison with similar homes in the area
Home Values in the Area
Average Home Value in this Area
Purchase History
| Date | Buyer | Sale Price | Title Company |
|---|---|---|---|
| Parra Stephanie Ray | $225,000 | First American Title | |
| Sauber Alice D | -- | First American Title | |
| Sauber Alice D | -- | None Available |
Source: Public Records
Mortgage History
| Date | Status | Borrower | Loan Amount |
|---|---|---|---|
| Open | Parra Stephanie Ray | $220,924 |
Source: Public Records
Tax History
| Year | Tax Paid | Tax Assessment Tax Assessment Total Assessment is a certain percentage of the fair market value that is determined by local assessors to be the total taxable value of land and additions on the property. | Land | Improvement |
|---|---|---|---|---|
| 2025 | $3,164 | $286,110 | $114,444 | $171,666 |
| 2024 | $3,164 | $280,500 | $112,200 | $168,300 |
| 2023 | $578 | $52,143 | $26,257 | $25,886 |
| 2022 | $568 | $51,122 | $25,743 | $25,379 |
| 2021 | $563 | $50,121 | $25,239 | $24,882 |
| 2020 | $555 | $49,608 | $24,981 | $24,627 |
| 2019 | $546 | $48,637 | $24,492 | $24,145 |
| 2018 | $528 | $47,684 | $24,012 | $23,672 |
| 2017 | $522 | $46,750 | $23,542 | $23,208 |
| 2016 | $528 | $45,834 | $23,081 | $22,753 |
| 2015 | $517 | $45,147 | $22,735 | $22,412 |
| 2014 | $504 | $44,263 | $22,290 | $21,973 |
Source: Public Records
Map
Nearby Homes
Your Personal Tour Guide
Ask me questions while you tour the home.