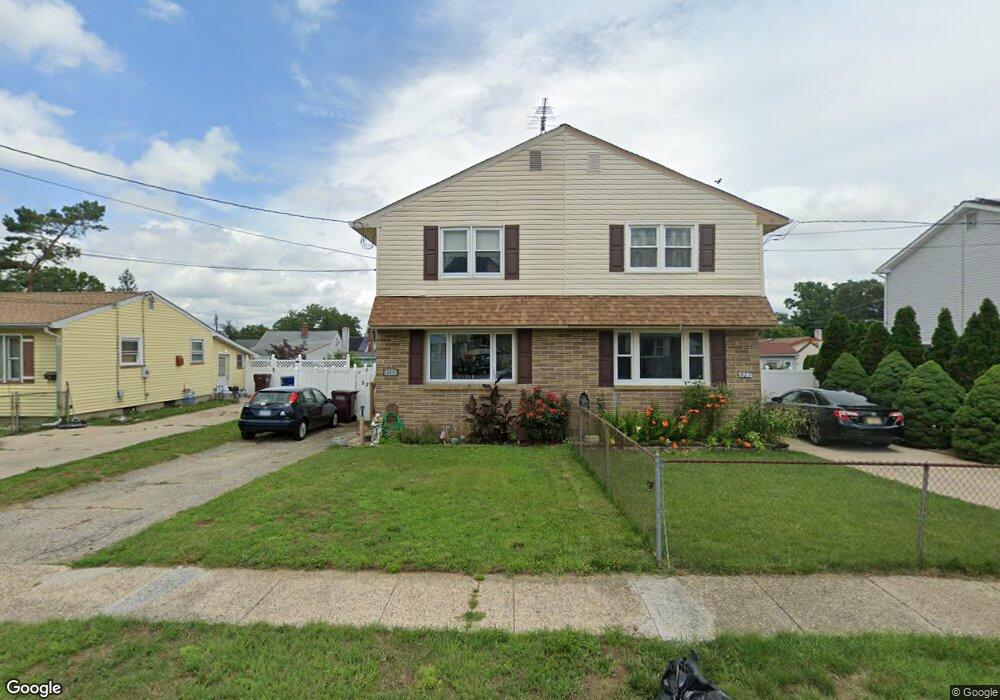
525 Filmore St Riverside, NJ 08075
Riverside Township NeighborhoodEstimated Value: $221,854 - $292,000
--
Bed
--
Bath
1,232
Sq Ft
$211/Sq Ft
Est. Value
About This Home
This home is located at 525 Filmore St, Riverside, NJ 08075 and is currently estimated at $259,964, approximately $211 per square foot. 525 Filmore St is a home located in Burlington County with nearby schools including Riverside Elementary School, Riverside Middle School, and Riverside High School.
Ownership History
Date
Name
Owned For
Owner Type
Purchase Details
Closed on
Jan 22, 1999
Sold by
Smith Edward T
Bought by
Smith Edward T and Smith Monica R
Current Estimated Value
Home Financials for this Owner
Home Financials are based on the most recent Mortgage that was taken out on this home.
Original Mortgage
$75,000
Outstanding Balance
$17,381
Interest Rate
6.75%
Estimated Equity
$242,583
Purchase Details
Closed on
Sep 30, 1994
Sold by
Delprete Franklin R and Delprete Mildred L
Bought by
Smith Edward T
Create a Home Valuation Report for This Property
The Home Valuation Report is an in-depth analysis detailing your home's value as well as a comparison with similar homes in the area
Home Values in the Area
Average Home Value in this Area
Purchase History
| Date | Buyer | Sale Price | Title Company |
|---|---|---|---|
| Smith Edward T | -- | Congress Title Corp | |
| Smith Edward T | $78,000 | Settlers Title Agency Lp |
Source: Public Records
Mortgage History
| Date | Status | Borrower | Loan Amount |
|---|---|---|---|
| Open | Smith Edward T | $75,000 |
Source: Public Records
Tax History Compared to Growth
Tax History
| Year | Tax Paid | Tax Assessment Tax Assessment Total Assessment is a certain percentage of the fair market value that is determined by local assessors to be the total taxable value of land and additions on the property. | Land | Improvement |
|---|---|---|---|---|
| 2025 | $4,949 | $120,600 | $39,900 | $80,700 |
| 2024 | $4,823 | $120,600 | $39,900 | $80,700 |
| 2023 | $4,823 | $120,600 | $39,900 | $80,700 |
| 2022 | $4,723 | $120,600 | $39,900 | $80,700 |
| 2021 | $4,672 | $120,600 | $39,900 | $80,700 |
| 2020 | $4,590 | $120,600 | $39,900 | $80,700 |
| 2019 | $4,520 | $120,600 | $39,900 | $80,700 |
| 2018 | $4,619 | $124,000 | $25,800 | $98,200 |
| 2017 | $4,495 | $124,000 | $25,800 | $98,200 |
| 2016 | $4,328 | $124,000 | $25,800 | $98,200 |
| 2015 | $4,245 | $124,000 | $25,800 | $98,200 |
| 2014 | $4,056 | $124,000 | $25,800 | $98,200 |
Source: Public Records
Map
Nearby Homes
- 514 Bridgeboro St
- 506 Bridgeboro St
- 649 Bridgeboro St
- 334 Kossuth St
- 224 E Washington St
- 327 Whittaker St
- 229 Filmore St
- 224 Progress St
- 304 Clay St
- 14 Grant St
- 77 Pennington Ct
- 528 S Fairview St
- 705 Arndt Ave
- 910 S Fairview St
- 11 Mccay Way
- 15 Mccay Way
- 423 Delaware Ave
- 580 N Pavilion Ave
- 601 Creek
- 212 Madison St