525 Forsyth Ln Unit B109 Edmonds, WA 98020
Pine Park NeighborhoodEstimated Value: $540,827 - $642,000
2
Beds
2
Baths
1,126
Sq Ft
$528/Sq Ft
Est. Value
About This Home
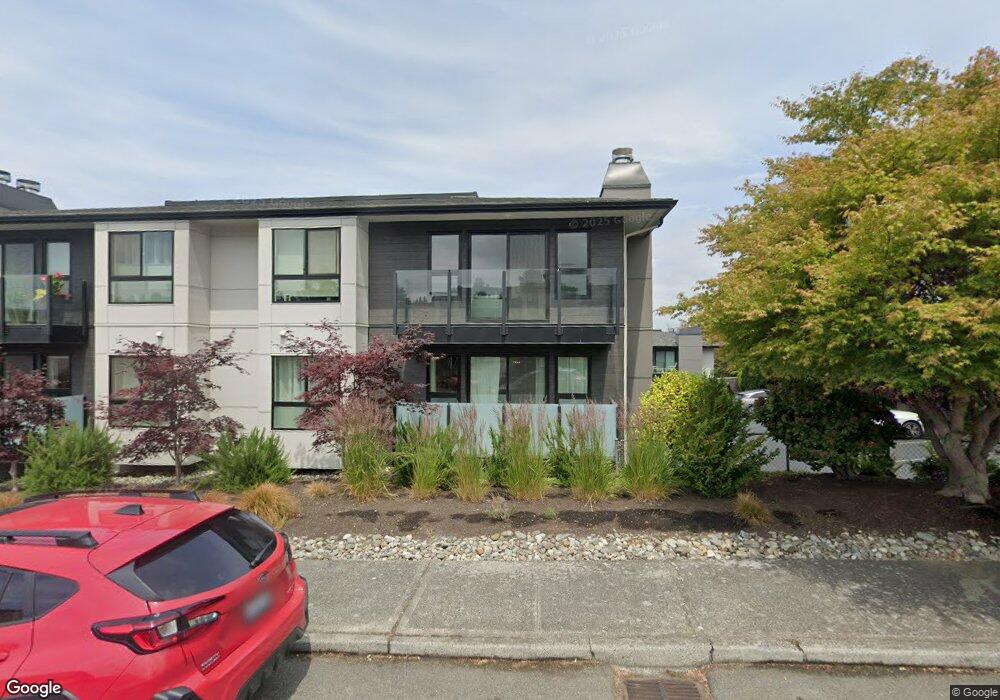
This home is located at 525 Forsyth Ln Unit B109, Edmonds, WA 98020 and is currently estimated at $594,707, approximately $528 per square foot. 525 Forsyth Ln Unit B109 is a home located in Snohomish County with nearby schools including Sherwood Elementary School, College Place Middle School, and Edmonds-Woodway High School.
Ownership History
Date
Name
Owned For
Owner Type
Purchase Details
Closed on
Sep 27, 2019
Sold by
Hyatt David Joe and Hyatt Judy
Bought by
Jeffrey Emma Joseph Bradshaw and Jeffery Family Trust
Current Estimated Value
Purchase Details
Closed on
Feb 27, 2008
Sold by
Hyatt Beatrice I
Bought by
Hyatt David and Hyatt Judy
Purchase Details
Closed on
Nov 21, 2002
Sold by
Petosa Robert L
Bought by
Hyatt Beatrice I
Purchase Details
Closed on
Aug 19, 1997
Sold by
Moore Margaret J
Bought by
Petosa Robert L
Home Financials for this Owner
Home Financials are based on the most recent Mortgage that was taken out on this home.
Original Mortgage
$55,000
Interest Rate
7.45%
Mortgage Type
Seller Take Back
Purchase Details
Closed on
May 22, 1997
Sold by
Demeree Fred and Demeree June L
Bought by
Moore Margaret J
Create a Home Valuation Report for This Property
The Home Valuation Report is an in-depth analysis detailing your home's value as well as a comparison with similar homes in the area
Home Values in the Area
Average Home Value in this Area
Purchase History
| Date | Buyer | Sale Price | Title Company |
|---|---|---|---|
| Jeffrey Emma Joseph Bradshaw | $390,000 | Cw Title | |
| Hyatt David | $30,550 | Chicago Title Insurance Co | |
| Hyatt Beatrice I | $233,000 | Old Republic Title Ltd | |
| Petosa Robert L | $155,500 | Old Republic Title Ltd | |
| Moore Margaret J | $156,000 | Old Republic Title Ltd |
Source: Public Records
Mortgage History
| Date | Status | Borrower | Loan Amount |
|---|---|---|---|
| Previous Owner | Petosa Robert L | $55,000 |
Source: Public Records
Tax History Compared to Growth
Tax History
| Year | Tax Paid | Tax Assessment Tax Assessment Total Assessment is a certain percentage of the fair market value that is determined by local assessors to be the total taxable value of land and additions on the property. | Land | Improvement |
|---|---|---|---|---|
| 2025 | $3,300 | $446,200 | $176,000 | $270,200 |
| 2024 | $3,300 | $462,400 | $176,000 | $286,400 |
| 2023 | $3,037 | $440,900 | $176,000 | $264,900 |
| 2022 | $3,210 | $383,400 | $160,000 | $223,400 |
| 2020 | $2,847 | $304,000 | $160,000 | $144,000 |
| 2019 | $604 | $304,000 | $160,000 | $144,000 |
| 2018 | $697 | $324,300 | $160,000 | $164,300 |
| 2017 | $581 | $236,000 | $97,000 | $139,000 |
| 2016 | $557 | $213,000 | $78,000 | $135,000 |
| 2015 | $592 | $213,000 | $71,500 | $141,500 |
| 2013 | $609 | $193,500 | $79,500 | $114,000 |
Source: Public Records
Map
Nearby Homes
- 960 5th Ave S Unit 208
- 1071 4th Ave S Unit 302
- 1110 5th Ave S Unit 204
- 550 Elm Way Unit 408
- 1140 3rd Ave S
- 637 Elm Place
- 335 3rd Ave S Unit 203
- 404 3rd Ave S Unit A201
- 302 6th Ave S
- 233 3rd Ave S Unit 304
- 816 Walnut St
- 1221 Coronado Place
- 50 Pine St Unit 103
- 22039 98th Place W
- 55 Pine St Unit 203
- 71 Pine St Unit 212
- 71 Pine St Unit 302
- 22430 Dogwood Ln
- 22628 106th Ave W
- 11110 Algonquin Rd
- 520 Pine St Unit 101
- 520 Pine St Unit 104
- 525 Forsyth Ln Unit B209
- 525 Forsyth Ln
- 525 Forsyth Ln Unit B207
- 525 Forsyth Ln
- 525 Forsyth Ln Unit B110
- 525 Forsyth Ln Unit B108
- 525 Forsyth Ln Unit B106
- 520 Pine St
- 520 Pine St Unit A203
- 520 Pine St Unit A202
- 520 Pine St Unit A201
- 520 Pine St Unit A105
- 520 Pine St
- 520 Pine St Unit A103
- 520 Pine St Unit A102
- 520 Pine St
- 525 Forsyth Ln