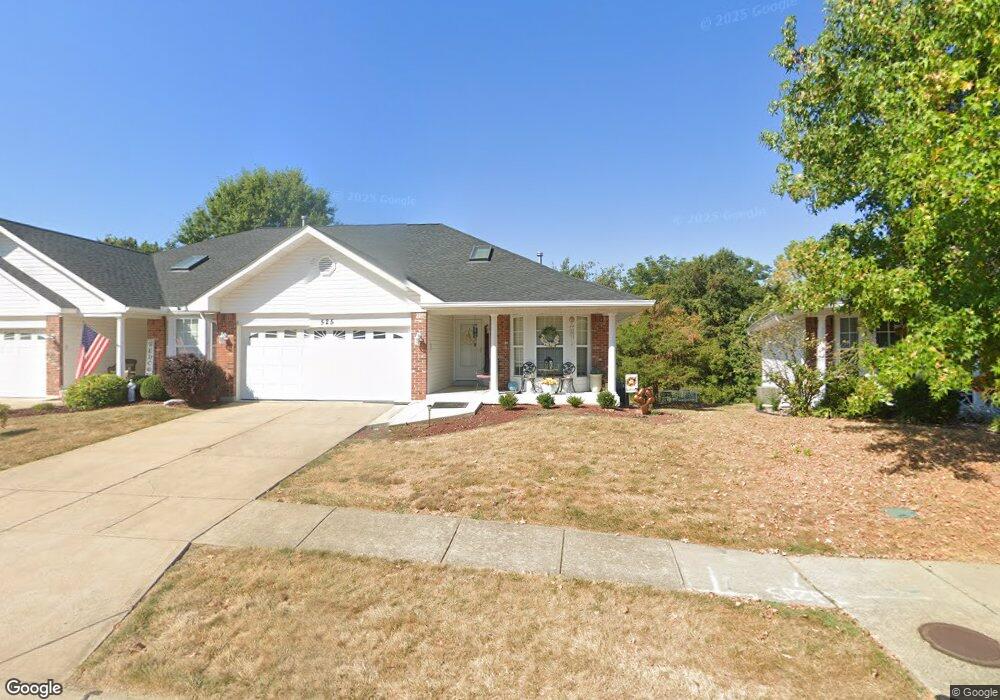
525 Galway Dr O Fallon, MO 63366
Estimated Value: $275,000 - $308,000
2
Beds
2
Baths
1,382
Sq Ft
$209/Sq Ft
Est. Value
About This Home
This home is located at 525 Galway Dr, O Fallon, MO 63366 and is currently estimated at $288,988, approximately $209 per square foot. 525 Galway Dr is a home located in St. Charles County with nearby schools including Joseph L. Mudd Elementary School, Forest Park Elementary School, and Fort Zumwalt North Middle School.
Ownership History
Date
Name
Owned For
Owner Type
Purchase Details
Closed on
Jan 3, 2023
Sold by
Thiel Lillie Ann
Bought by
Carey Lisa Marie
Current Estimated Value
Home Financials for this Owner
Home Financials are based on the most recent Mortgage that was taken out on this home.
Original Mortgage
$150,000
Outstanding Balance
$145,344
Interest Rate
6.58%
Mortgage Type
New Conventional
Estimated Equity
$143,644
Purchase Details
Closed on
Sep 8, 2005
Sold by
Livin Yerke Ernest J and Livin Ernest J Yerke Revocable
Bought by
Thiel Richard H and Thiel Lillie Ann
Home Financials for this Owner
Home Financials are based on the most recent Mortgage that was taken out on this home.
Original Mortgage
$100,000
Interest Rate
5.8%
Mortgage Type
New Conventional
Purchase Details
Closed on
Oct 1, 1999
Sold by
Chapel Hill Partnership
Bought by
Woodlawn Homeowners Assn
Create a Home Valuation Report for This Property
The Home Valuation Report is an in-depth analysis detailing your home's value as well as a comparison with similar homes in the area
Home Values in the Area
Average Home Value in this Area
Purchase History
| Date | Buyer | Sale Price | Title Company |
|---|---|---|---|
| Carey Lisa Marie | -- | Title Partners | |
| Thiel Richard H | $182,000 | Ust | |
| Woodlawn Homeowners Assn | -- | -- |
Source: Public Records
Mortgage History
| Date | Status | Borrower | Loan Amount |
|---|---|---|---|
| Open | Carey Lisa Marie | $150,000 | |
| Previous Owner | Thiel Richard H | $100,000 |
Source: Public Records
Tax History
| Year | Tax Paid | Tax Assessment Tax Assessment Total Assessment is a certain percentage of the fair market value that is determined by local assessors to be the total taxable value of land and additions on the property. | Land | Improvement |
|---|---|---|---|---|
| 2025 | $3,510 | $54,628 | -- | -- |
| 2023 | $3,511 | $52,988 | $0 | $0 |
| 2022 | $2,831 | $39,659 | $0 | $0 |
| 2021 | $2,833 | $39,659 | $0 | $0 |
| 2020 | $2,563 | $34,765 | $0 | $0 |
| 2019 | $2,569 | $34,765 | $0 | $0 |
| 2018 | $2,245 | $28,958 | $0 | $0 |
| 2017 | $2,210 | $28,958 | $0 | $0 |
| 2016 | $2,247 | $29,337 | $0 | $0 |
| 2015 | $2,089 | $29,337 | $0 | $0 |
| 2014 | $2,084 | $28,776 | $0 | $0 |
Source: Public Records
Map
Nearby Homes
- 423 Woodlawn Ave
- 731 Cordes St
- 0 Montbrook Dr
- 503 Imperial Ct
- 205 E Elm St
- 309 E Pitman St
- 734 Sunset Ln
- 24 Hawthorne Ct
- 151 N Wellington St
- 38 Downing St
- 203 Saint Margaret Ln
- 18 Plackemeier Dr
- 4 Shinnecock Hills
- 201 Allen Dr
- 6 Emerson Ct
- 409 Saint Joseph Ave
- 508 Saint Christopher Dr
- 6 S Boxwood Ln
- 962 Midpoint Dr
- 10 Southern Hills Ct
Your Personal Tour Guide
Ask me questions while you tour the home.