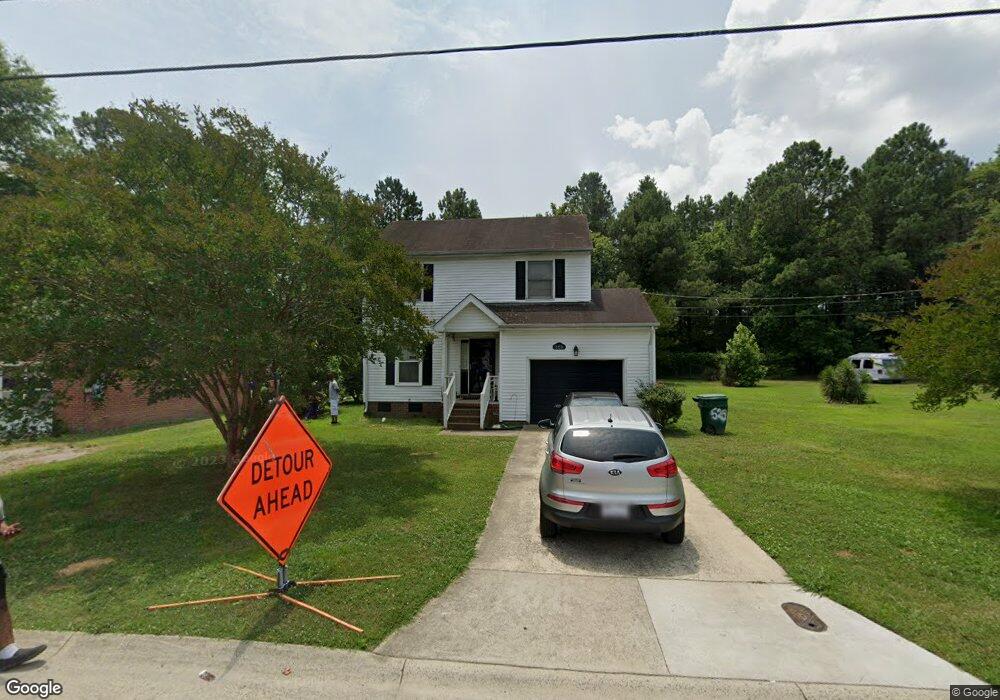
525 Kilby Ave Suffolk, VA 23434
Holy Neck NeighborhoodEstimated Value: $257,000 - $272,000
3
Beds
3
Baths
1,776
Sq Ft
$148/Sq Ft
Est. Value
About This Home
This home is located at 525 Kilby Ave, Suffolk, VA 23434 and is currently estimated at $263,540, approximately $148 per square foot. 525 Kilby Ave is a home located in Suffolk City with nearby schools including Hillpoint Elementary School, Forest Glen Middle School, and Lakeland High School.
Ownership History
Date
Name
Owned For
Owner Type
Purchase Details
Closed on
Mar 22, 2024
Sold by
Linton Paxton Kirby and Linton Willie
Bought by
Torres Carolina
Current Estimated Value
Home Financials for this Owner
Home Financials are based on the most recent Mortgage that was taken out on this home.
Original Mortgage
$252,514
Outstanding Balance
$248,500
Interest Rate
6.87%
Mortgage Type
VA
Estimated Equity
$15,040
Create a Home Valuation Report for This Property
The Home Valuation Report is an in-depth analysis detailing your home's value as well as a comparison with similar homes in the area
Home Values in the Area
Average Home Value in this Area
Purchase History
| Date | Buyer | Sale Price | Title Company |
|---|---|---|---|
| Torres Carolina | $247,200 | Title Resource Guaranty Compan |
Source: Public Records
Mortgage History
| Date | Status | Borrower | Loan Amount |
|---|---|---|---|
| Open | Torres Carolina | $252,514 |
Source: Public Records
Tax History Compared to Growth
Tax History
| Year | Tax Paid | Tax Assessment Tax Assessment Total Assessment is a certain percentage of the fair market value that is determined by local assessors to be the total taxable value of land and additions on the property. | Land | Improvement |
|---|---|---|---|---|
| 2024 | $2,525 | $187,700 | $44,500 | $143,200 |
| 2023 | $2,401 | $179,300 | $42,400 | $136,900 |
| 2022 | $1,815 | $166,500 | $30,300 | $136,200 |
| 2021 | $1,780 | $160,400 | $24,200 | $136,200 |
| 2020 | $1,623 | $146,200 | $22,000 | $124,200 |
| 2019 | $1,623 | $146,200 | $22,000 | $124,200 |
| 2018 | $1,751 | $145,400 | $22,000 | $123,400 |
| 2017 | $1,556 | $145,400 | $22,000 | $123,400 |
| 2016 | $1,556 | $145,400 | $22,000 | $123,400 |
| 2015 | $927 | $151,300 | $22,000 | $129,300 |
| 2014 | $927 | $151,300 | $22,000 | $129,300 |
Source: Public Records
Map
Nearby Homes