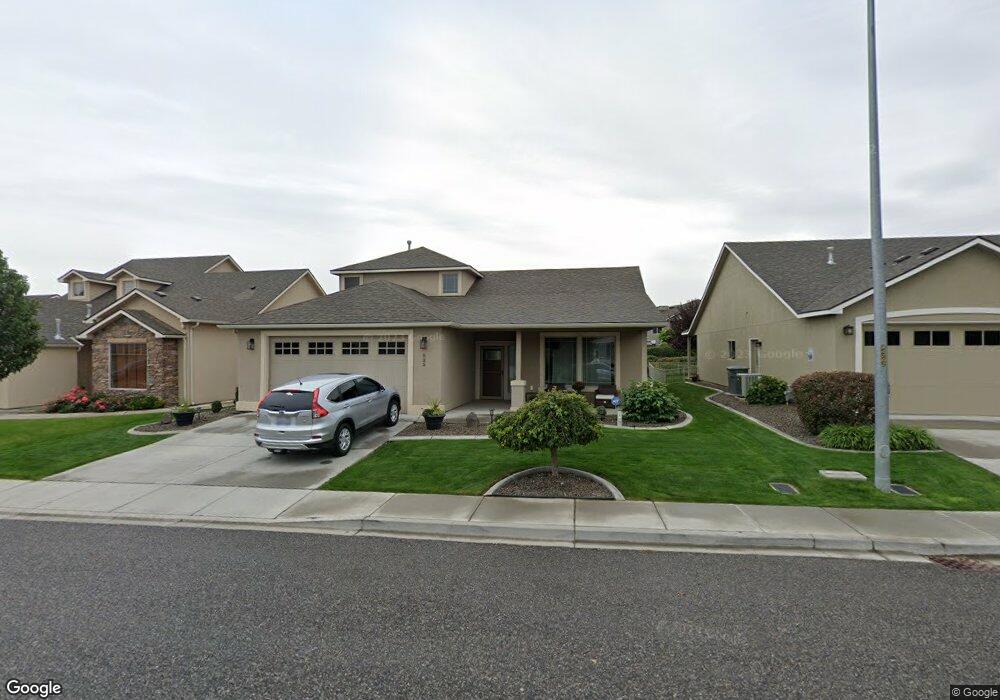
525 Lakerose Loop Richland, WA 99352
Estimated Value: $416,000 - $543,000
3
Beds
3
Baths
1,980
Sq Ft
$245/Sq Ft
Est. Value
About This Home
This home is located at 525 Lakerose Loop, Richland, WA 99352 and is currently estimated at $484,639, approximately $244 per square foot. 525 Lakerose Loop is a home located in Benton County with nearby schools including Orchard Elementary School, Enterprise Middle School, and Richland High School.
Ownership History
Date
Name
Owned For
Owner Type
Purchase Details
Closed on
Sep 24, 2019
Sold by
Jaramillo Yvette J and Riggs Yvette
Bought by
Jaramillo Yvette J
Current Estimated Value
Home Financials for this Owner
Home Financials are based on the most recent Mortgage that was taken out on this home.
Original Mortgage
$249,900
Outstanding Balance
$216,966
Interest Rate
3.6%
Mortgage Type
New Conventional
Estimated Equity
$267,673
Purchase Details
Closed on
Apr 19, 2010
Sold by
Badger Mountain Construction Llc
Bought by
Riggs Yvette
Home Financials for this Owner
Home Financials are based on the most recent Mortgage that was taken out on this home.
Original Mortgage
$235,554
Interest Rate
4.62%
Mortgage Type
FHA
Purchase Details
Closed on
Nov 28, 2007
Sold by
Badger Mountain Village Investments Llc
Bought by
Badger Mountain Construction Llc
Create a Home Valuation Report for This Property
The Home Valuation Report is an in-depth analysis detailing your home's value as well as a comparison with similar homes in the area
Home Values in the Area
Average Home Value in this Area
Purchase History
| Date | Buyer | Sale Price | Title Company |
|---|---|---|---|
| Jaramillo Yvette J | -- | Stewart Title Company | |
| Riggs Yvette | $239,900 | Cascade Title | |
| Badger Mountain Construction Llc | -- | Benton Franklin Titl |
Source: Public Records
Mortgage History
| Date | Status | Borrower | Loan Amount |
|---|---|---|---|
| Open | Jaramillo Yvette J | $249,900 | |
| Closed | Riggs Yvette | $235,554 |
Source: Public Records
Tax History
| Year | Tax Paid | Tax Assessment Tax Assessment Total Assessment is a certain percentage of the fair market value that is determined by local assessors to be the total taxable value of land and additions on the property. | Land | Improvement |
|---|---|---|---|---|
| 2025 | $447 | $520,950 | $85,000 | $435,950 |
| 2024 | $4,097 | $472,860 | $85,000 | $387,860 |
| 2023 | $4,097 | $438,630 | $85,000 | $353,630 |
| 2022 | $3,716 | $370,190 | $85,000 | $285,190 |
| 2021 | $3,612 | $335,970 | $85,000 | $250,970 |
| 2020 | $3,828 | $313,150 | $85,000 | $228,150 |
| 2019 | $3,132 | $313,980 | $48,500 | $265,480 |
| 2018 | $3,230 | $276,060 | $48,500 | $227,560 |
| 2017 | $2,853 | $238,130 | $48,500 | $189,630 |
| 2016 | $3,162 | $238,130 | $48,500 | $189,630 |
| 2015 | $3,208 | $238,130 | $48,500 | $189,630 |
| 2014 | -- | $238,130 | $48,500 | $189,630 |
| 2013 | -- | $238,130 | $48,500 | $189,630 |
Source: Public Records
Map
Nearby Homes
- 586 Lodi Loop
- 1430 Purple Sage St
- 1418 Chardonnay Dr
- 1269 Jubilee St
- 654 Nastacia St
- 1240 Vintage Ave
- 1557 Livorno Ave
- 664 Punkie Ln
- 566 Oahu St
- 1716 Manchester St
- 430 Keene Rd
- 1359 White Bluffs St
- 1658 Sorrento Ln
- 1640 Palermo Ave
- 1133 Fairhaven Loop Unit 9
- 1101 Fairhaven Loop
- 1352 Westgate Way
- 1634 Verona Ln
- 1157 Fairhaven Loop Unit 15
- 1149 Fairhaven Loop Unit 13
- 521 Lakerose Loop
- 529 Lakerose Loop
- 517 Lakerose Loop
- 533 Lakerose Loop
- 407 Piper St
- 401 Piper St
- 524 Lakerose Loop
- 528 Lakerose Loop
- 532 Lakerose Loop
- 520 Lakerose Loop
- 537 Lakerose Loop
- 511 Lakerose Loop
- 536 Lakerose Loop
- 516 Lakerose Loop
- 421 Lakerose Loop
- 425 Lakerose Loop
- 417 Lakerose Loop
- 541 Lakerose Loop
- 540 Lakerose Loop
- 429 Lakerose Loop
Your Personal Tour Guide
Ask me questions while you tour the home.