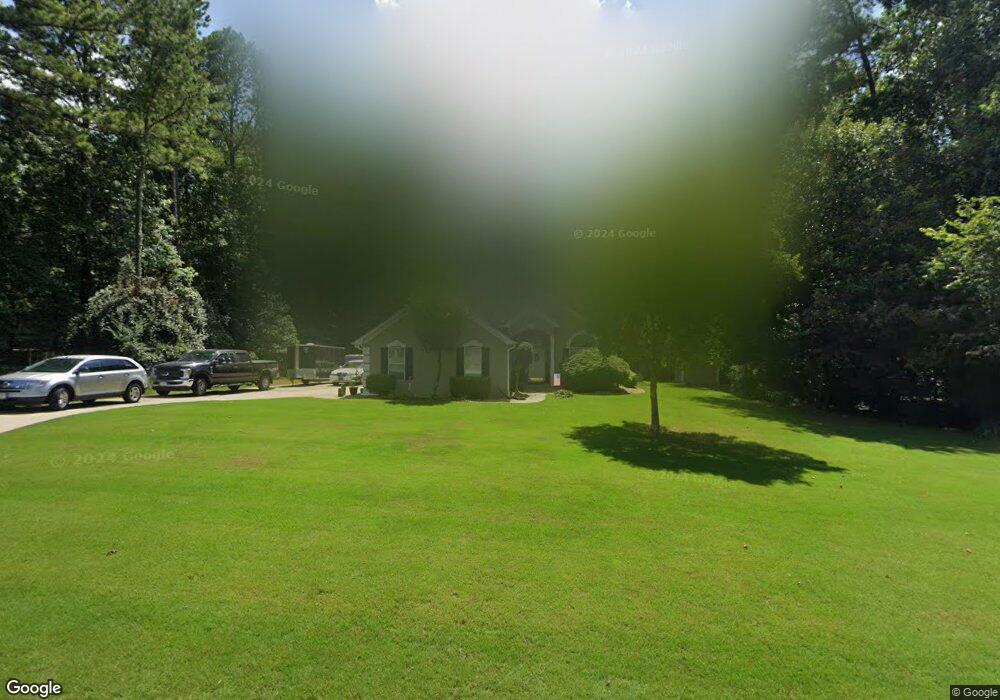
525 Line Creek Cir Sharpsburg, GA 30277
Estimated Value: $304,448 - $376,000
3
Beds
2
Baths
1,403
Sq Ft
$243/Sq Ft
Est. Value
About This Home
This home is located at 525 Line Creek Cir, Sharpsburg, GA 30277 and is currently estimated at $341,112, approximately $243 per square foot. 525 Line Creek Cir is a home located in Coweta County with nearby schools including Canongate Elementary School, Madras Middle School, and Northgate High School.
Ownership History
Date
Name
Owned For
Owner Type
Purchase Details
Closed on
Jan 3, 2014
Sold by
Schell Phillip F
Bought by
Widdowson Timothy C and Widdowson Jeryl L
Current Estimated Value
Purchase Details
Closed on
Jul 28, 2013
Sold by
Schell Judy S
Bought by
Schell Phillip F and Schell Rodney S
Purchase Details
Closed on
Jul 31, 2002
Sold by
Thompson Clifton R
Bought by
Schell Judy S
Purchase Details
Closed on
Jul 25, 1995
Sold by
Pelletier Prop
Bought by
Thompson Clifton and Ponder Stephanie
Purchase Details
Closed on
Aug 8, 1994
Bought by
Pelletier Properties
Purchase Details
Closed on
May 28, 1993
Bought by
Zippilli Harriette H
Purchase Details
Closed on
May 21, 1993
Bought by
Trust Co Bank Of Nor
Purchase Details
Closed on
Apr 30, 1993
Bought by
H & A Investments In
Create a Home Valuation Report for This Property
The Home Valuation Report is an in-depth analysis detailing your home's value as well as a comparison with similar homes in the area
Home Values in the Area
Average Home Value in this Area
Purchase History
| Date | Buyer | Sale Price | Title Company |
|---|---|---|---|
| Widdowson Timothy C | $120,000 | -- | |
| Schell Phillip F | -- | -- | |
| Schell Judy S | $154,500 | -- | |
| Thompson Clifton | $99,900 | -- | |
| Pelletier Properties | $80,000 | -- | |
| Zippilli Harriette H | $300,000 | -- | |
| Trust Co Bank Of Nor | -- | -- | |
| H & A Investments In | $300,000 | -- |
Source: Public Records
Mortgage History
| Date | Status | Borrower | Loan Amount |
|---|---|---|---|
| Closed | Thompson Clifton | $0 |
Source: Public Records
Tax History Compared to Growth
Tax History
| Year | Tax Paid | Tax Assessment Tax Assessment Total Assessment is a certain percentage of the fair market value that is determined by local assessors to be the total taxable value of land and additions on the property. | Land | Improvement |
|---|---|---|---|---|
| 2025 | $2,050 | $131,804 | $30,000 | $101,804 |
| 2024 | $1,753 | $116,556 | $26,000 | $90,556 |
| 2023 | $1,753 | $119,610 | $26,000 | $93,610 |
| 2022 | $1,428 | $98,402 | $26,000 | $72,402 |
| 2021 | $954 | $76,844 | $18,000 | $58,844 |
| 2020 | $1,959 | $76,844 | $18,000 | $58,844 |
| 2019 | $1,743 | $62,731 | $16,000 | $46,731 |
| 2018 | $1,887 | $62,731 | $16,000 | $46,731 |
| 2017 | $1,655 | $54,837 | $12,000 | $42,837 |
| 2016 | $1,636 | $54,837 | $12,000 | $42,837 |
| 2015 | $1,687 | $57,563 | $12,000 | $45,563 |
| 2014 | $430 | $47,761 | $12,000 | $35,761 |
Source: Public Records
Map
Nearby Homes
- 11 Line Creek Cir
- 121 Northwoods Rd
- 95 Tyler Woods Dr
- 25 Sycamore Way
- 100 Ashland Trail
- 12 Race Point Way
- 104 Ashland Trail
- 319 Beaconsfield Dr
- 259 Strathmore Dr Unit 3
- 150 Kylemore Pass
- 110 Kylemore Pass
- 10 Monteray Ct
- 125 Cannongate Cir
- 20 Skipton Ct
- 131 Cannongate Cir
- 40 Wenham Ln
- 70 N Strathmore Dr
- 75 Tomahawk Dr
- 135 Crimson Ridge
- 100 Clydesdale Ct
- 0 Line Creek Cir Unit 8690189
- 0 Line Creek Cir Unit 8651489
- 0 Line Creek Cir Unit 8969774
- 0 Line Creek Cir Unit 7143975
- 0 Line Creek Cir Unit 7278979
- 0 Line Creek Cir Unit 7285649
- 0 Line Creek Cir Unit 7284304
- 0 Line Creek Cir Unit 7375295
- 0 Line Creek Cir Unit 7389196
- 0 Line Creek Cir Unit 7501018
- 0 Line Creek Cir Unit 8126239
- 0 Line Creek Cir Unit 8280971
- 0 Line Creek Cir Unit 8298047
- 0 Line Creek Cir Unit 8353917
- 0 Line Creek Cir Unit 8378882
- 0 Line Creek Cir Unit 8382920
- 0 Line Creek Cir Unit 8449171
- 535 Line Creek Cir
- 505 Line Creek Cir
- 516 Line Creek Cir