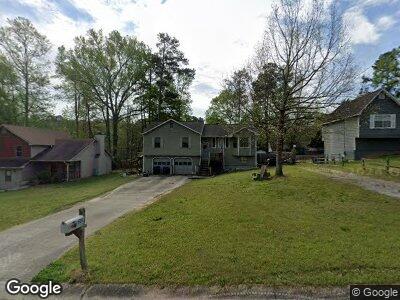
525 Pebble Point Dr Loganville, GA 30052
Estimated Value: $279,000 - $296,000
--
Bed
--
Bath
1,651
Sq Ft
$176/Sq Ft
Est. Value
About This Home
This home is located at 525 Pebble Point Dr, Loganville, GA 30052 and is currently estimated at $290,880, approximately $176 per square foot. 525 Pebble Point Dr is a home located in Walton County with nearby schools including Bay Creek Elementary School, Loganville Middle School, and Loganville High School.
Ownership History
Date
Name
Owned For
Owner Type
Purchase Details
Closed on
Apr 24, 2008
Sold by
Kadoshima Julie
Bought by
Kadoshima Julie and Devries Jeffrey
Current Estimated Value
Home Financials for this Owner
Home Financials are based on the most recent Mortgage that was taken out on this home.
Original Mortgage
$108,550
Outstanding Balance
$71,287
Interest Rate
5.84%
Mortgage Type
New Conventional
Estimated Equity
$212,722
Purchase Details
Closed on
Jul 20, 2007
Sold by
Copeland Erin L and Copeland Steve
Bought by
Kadoshima Julie
Home Financials for this Owner
Home Financials are based on the most recent Mortgage that was taken out on this home.
Original Mortgage
$107,200
Interest Rate
6.52%
Mortgage Type
New Conventional
Purchase Details
Closed on
Aug 29, 1997
Sold by
Hunt David E
Bought by
Copeland Erin L and Copeland Steve
Purchase Details
Closed on
Aug 29, 1988
Bought by
Hunt David E
Create a Home Valuation Report for This Property
The Home Valuation Report is an in-depth analysis detailing your home's value as well as a comparison with similar homes in the area
Home Values in the Area
Average Home Value in this Area
Purchase History
| Date | Buyer | Sale Price | Title Company |
|---|---|---|---|
| Kadoshima Julie | -- | -- | |
| Kadoshima Julie | $134,000 | -- | |
| Copeland Erin L | $27,200 | -- | |
| Hunt David E | $72,900 | -- |
Source: Public Records
Mortgage History
| Date | Status | Borrower | Loan Amount |
|---|---|---|---|
| Open | Kadoshima Julie | $20,000 | |
| Closed | Kadoshima Julie | $108,550 | |
| Previous Owner | Kadoshima Julie | $107,200 | |
| Previous Owner | Copeland Steve E | $103,530 | |
| Closed | Copeland Erin L | -- |
Source: Public Records
Tax History Compared to Growth
Tax History
| Year | Tax Paid | Tax Assessment Tax Assessment Total Assessment is a certain percentage of the fair market value that is determined by local assessors to be the total taxable value of land and additions on the property. | Land | Improvement |
|---|---|---|---|---|
| 2024 | $3,047 | $97,880 | $20,400 | $77,480 |
| 2023 | $3,140 | $96,600 | $20,400 | $76,200 |
| 2022 | $1,961 | $76,720 | $14,000 | $62,720 |
| 2021 | $1,565 | $54,240 | $10,000 | $44,240 |
| 2020 | $1,596 | $53,720 | $8,400 | $45,320 |
| 2019 | $1,538 | $50,680 | $8,400 | $42,280 |
| 2018 | $1,532 | $50,680 | $8,400 | $42,280 |
| 2017 | $1,926 | $43,720 | $8,400 | $35,320 |
| 2016 | $1,353 | $42,960 | $8,400 | $34,560 |
| 2015 | $1,154 | $36,560 | $8,400 | $28,160 |
| 2014 | $797 | $25,320 | $0 | $0 |
Source: Public Records
Map
Nearby Homes
- 1109 Granite Ln
- 35 Henson Farm Dr
- 1800 Pearson St
- 4377 Leighton Ct
- 0000 Lee Byrd Rd
- 412 Live Oak Pass
- 632 Hunters Cove Ln
- 938 Blue Juniper Cir
- 799 Blue Juniper Cir
- 507 Mockingbird Ln
- 410 Mockingbird Dr
- 711 Wilhaven Ct
- 732 Jacoby Dr
- 0 Old Zion Cemetery Rd Unit 10310202
- 0 Old Zion Cemetery Rd Unit 7396101
- 517 Mary Margaret Walk
- 866 Lee Byrd Rd
- 2221 Baker Carter Dr
- 403 Sonja Ln
- 525 Pebble Point Dr
- 521 Pebble Point Dr
- 529 Pebble Point Dr
- 0 Pebble Point Dr Unit 7407055
- 0 Pebble Point Dr Unit 7291711
- 0 Pebble Point Dr Unit 7197507
- 0 Pebble Point Dr Unit 7157117
- 0 Pebble Point Dr Unit 7113458
- 0 Pebble Point Dr Unit 3272344
- 0 Pebble Point Dr Unit 8747988
- 0 Pebble Point Dr Unit 8337441
- 0 Pebble Point Dr Unit 8312790
- 0 Pebble Point Dr Unit 7261627
- 0 Pebble Point Dr Unit 7455417
- 0 Pebble Point Dr Unit 7350404
- 0 Pebble Point Dr Unit 7300313
- 0 Pebble Point Dr Unit 8974089
- 0 Pebble Point Dr Unit 8993515
- 0 Pebble Point Dr Unit 9011367
- 0 Pebble Point Dr Unit 19 9060349