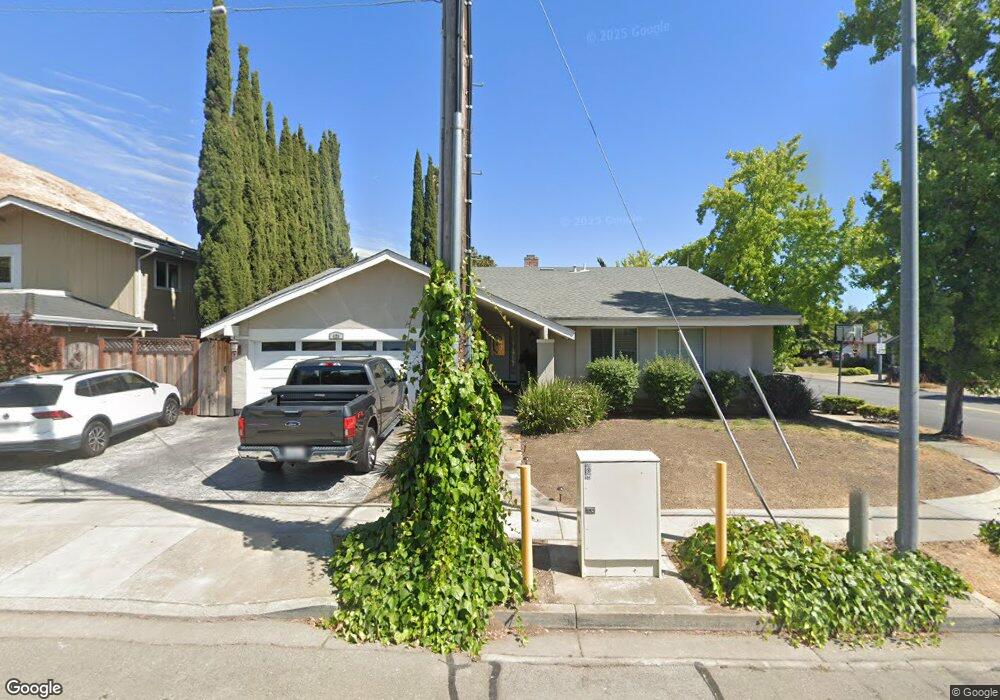
525 Pickering Ave Fremont, CA 94536
Canyon Heights-Vallejo Mills NeighborhoodEstimated Value: $1,331,000 - $2,077,000
4
Beds
2
Baths
1,788
Sq Ft
$975/Sq Ft
Est. Value
About This Home
This home is located at 525 Pickering Ave, Fremont, CA 94536 and is currently estimated at $1,743,444, approximately $975 per square foot. 525 Pickering Ave is a home located in Alameda County with nearby schools including Vallejo Mill Elementary School, Centerville Junior High School, and Washington High School.
Ownership History
Date
Name
Owned For
Owner Type
Purchase Details
Closed on
Nov 1, 2002
Sold by
Tafoya Julie and Tafoya Jeremy
Bought by
Tafoya Jeremy and Tafoya Julie
Current Estimated Value
Home Financials for this Owner
Home Financials are based on the most recent Mortgage that was taken out on this home.
Original Mortgage
$428,000
Outstanding Balance
$165,780
Interest Rate
5%
Mortgage Type
Purchase Money Mortgage
Estimated Equity
$1,577,664
Purchase Details
Closed on
Jun 22, 1999
Sold by
Faria Sharon L
Bought by
Tafoya Julie and Tafoya Jerome
Home Financials for this Owner
Home Financials are based on the most recent Mortgage that was taken out on this home.
Original Mortgage
$240,000
Interest Rate
7.2%
Purchase Details
Closed on
Oct 28, 1997
Sold by
Faria Sharon L
Bought by
Faria Sharon L
Home Financials for this Owner
Home Financials are based on the most recent Mortgage that was taken out on this home.
Original Mortgage
$270,000
Interest Rate
7.26%
Create a Home Valuation Report for This Property
The Home Valuation Report is an in-depth analysis detailing your home's value as well as a comparison with similar homes in the area
Home Values in the Area
Average Home Value in this Area
Purchase History
| Date | Buyer | Sale Price | Title Company |
|---|---|---|---|
| Tafoya Jeremy | -- | New Century Title Company | |
| Tafoya Jeremy | $143,000 | New Century Title Company | |
| Tafoya Julie | $377,000 | Fidelity National Title Co | |
| Faria Sharon L | -- | Chicago Title Co |
Source: Public Records
Mortgage History
| Date | Status | Borrower | Loan Amount |
|---|---|---|---|
| Open | Tafoya Jeremy | $428,000 | |
| Closed | Tafoya Julie | $240,000 | |
| Previous Owner | Faria Sharon L | $270,000 | |
| Closed | Tafoya Julie | $42,000 |
Source: Public Records
Tax History Compared to Growth
Tax History
| Year | Tax Paid | Tax Assessment Tax Assessment Total Assessment is a certain percentage of the fair market value that is determined by local assessors to be the total taxable value of land and additions on the property. | Land | Improvement |
|---|---|---|---|---|
| 2025 | $7,846 | $632,702 | $189,569 | $450,133 |
| 2024 | $7,846 | $620,162 | $185,853 | $441,309 |
| 2023 | $7,630 | $614,869 | $182,210 | $432,659 |
| 2022 | $7,522 | $595,814 | $178,637 | $424,177 |
| 2021 | $7,339 | $583,998 | $175,136 | $415,862 |
| 2020 | $7,333 | $584,942 | $173,341 | $411,601 |
| 2019 | $7,250 | $573,475 | $169,943 | $403,532 |
| 2018 | $7,107 | $562,233 | $166,612 | $395,621 |
| 2017 | $6,928 | $551,212 | $163,346 | $387,866 |
| 2016 | $6,806 | $540,407 | $160,144 | $380,263 |
| 2015 | $6,711 | $532,293 | $157,739 | $374,554 |
| 2014 | $6,592 | $521,868 | $154,650 | $367,218 |
Source: Public Records
Map
Nearby Homes
- 599 Wasatch Dr
- 22 Sea Crest Terrace
- 38367 Oliver Way
- 38345 Timpanogas Cir
- 711 Old Canyon Rd Unit SPC 33
- 711 Old Canyon Rd Unit 6
- 711 Old Canyon Rd Unit 97
- 711 Old Canyon Rd Unit 77
- 711 Old Canyon Rd Unit 47
- 711 Old Canyon Rd Unit 176
- 711 Old Canyon Rd Unit 103
- 711 Old Canyon Rd Unit 56
- 4 Morrison Canyon Rd
- 2 Morrison Canyon Rd
- 3 Morrison Canyon Rd
- 38555 Overacker Ave
- 111 Overacker Terrace
- 865 Old Canyon Rd
- 118 Sycamore St
- 38521 Royal Ann Common
- 545 Pickering Ave
- 514 Flora Place
- 530 Flora Place
- 565 Pickering Ave
- 38731 Tierra St
- 548 Flora Place
- 38749 Tierra St
- 525 Lowell Place
- 511 Lowell Place
- 491 Lowell Place
- 575 Pickering Ave
- 450 Flora Place
- 566 Flora Place
- 580 Pickering Ave
- 515 Flora Place
- 487 Lowell Place
- 499 Flora Place
- 531 Flora Place
- 483 Flora Place
- 585 Pickering Ave