525 Ruble Rd Crows Landing, CA 95313
Estimated Value: $311,000
2
Beds
1
Bath
952
Sq Ft
$327/Sq Ft
Est. Value
About This Home
This home is located at 525 Ruble Rd, Crows Landing, CA 95313 and is currently estimated at $311,000, approximately $326 per square foot. 525 Ruble Rd is a home located in Stanislaus County with nearby schools including Chatom Elementary School, Mountain View Middle School, and Turlock Junior High School.
Ownership History
Date
Name
Owned For
Owner Type
Purchase Details
Closed on
Dec 19, 2019
Sold by
Herrera Sabino Ahlem and Herrera Lindsey E
Bought by
Azevedo Manuel J and Azevedo Maria E
Current Estimated Value
Home Financials for this Owner
Home Financials are based on the most recent Mortgage that was taken out on this home.
Original Mortgage
$5,000,000
Outstanding Balance
$4,416,832
Interest Rate
3.7%
Mortgage Type
Credit Line Revolving
Estimated Equity
-$4,105,832
Purchase Details
Closed on
Jul 12, 2018
Sold by
Herrera Sabino Ahlem and Herrera Lindsey E
Bought by
Herrera Sabino Ahlem and Herrera Lindsey E
Purchase Details
Closed on
Feb 24, 2015
Sold by
Herrera Rogelio
Bought by
R & T Herrera 2015 Trust
Purchase Details
Closed on
Oct 25, 2011
Sold by
Central California Oil Co
Bought by
Oliveira Manuel and Oliveira Maria B
Purchase Details
Closed on
Oct 19, 2011
Sold by
Herrera Teresa
Bought by
Herrera Rogelio
Create a Home Valuation Report for This Property
The Home Valuation Report is an in-depth analysis detailing your home's value as well as a comparison with similar homes in the area
Purchase History
| Date | Buyer | Sale Price | Title Company |
|---|---|---|---|
| Azevedo Manuel J | $8,000,000 | Stewart Title Of Ca Inc | |
| Herrera Sabino Ahlem | -- | None Available | |
| R & T Herrera 2015 Trust | -- | None Available | |
| Oliveira Manuel | -- | Stewart Title Of California | |
| Herrera Rogelio | -- | Stewart Title Of California | |
| Herrera Sabino Ahlem | $400,000 | Stewart Title Of California |
Source: Public Records
Mortgage History
| Date | Status | Borrower | Loan Amount |
|---|---|---|---|
| Open | Azevedo Manuel J | $5,000,000 |
Source: Public Records
Tax History
| Year | Tax Paid | Tax Assessment Tax Assessment Total Assessment is a certain percentage of the fair market value that is determined by local assessors to be the total taxable value of land and additions on the property. | Land | Improvement |
|---|---|---|---|---|
| 2025 | $3,703 | $297,930 | $145,369 | $152,561 |
| 2024 | $3,770 | $307,802 | $158,232 | $149,570 |
| 2023 | $3,861 | $311,355 | $164,717 | $146,638 |
| 2022 | $3,829 | $307,453 | $163,690 | $143,763 |
| 2021 | $3,753 | $299,713 | $158,768 | $140,945 |
| 2020 | $3,636 | $289,472 | $149,972 | $139,500 |
| 2019 | $3,587 | $285,390 | $130,847 | $154,543 |
| 2018 | $3,336 | $255,994 | $104,481 | $151,513 |
| 2017 | $3,158 | $243,205 | $94,662 | $148,543 |
| 2016 | $3,030 | $235,663 | $90,032 | $145,631 |
| 2015 | $3,023 | $233,454 | $90,010 | $143,444 |
| 2014 | $2,945 | $226,484 | $85,849 | $140,635 |
Source: Public Records
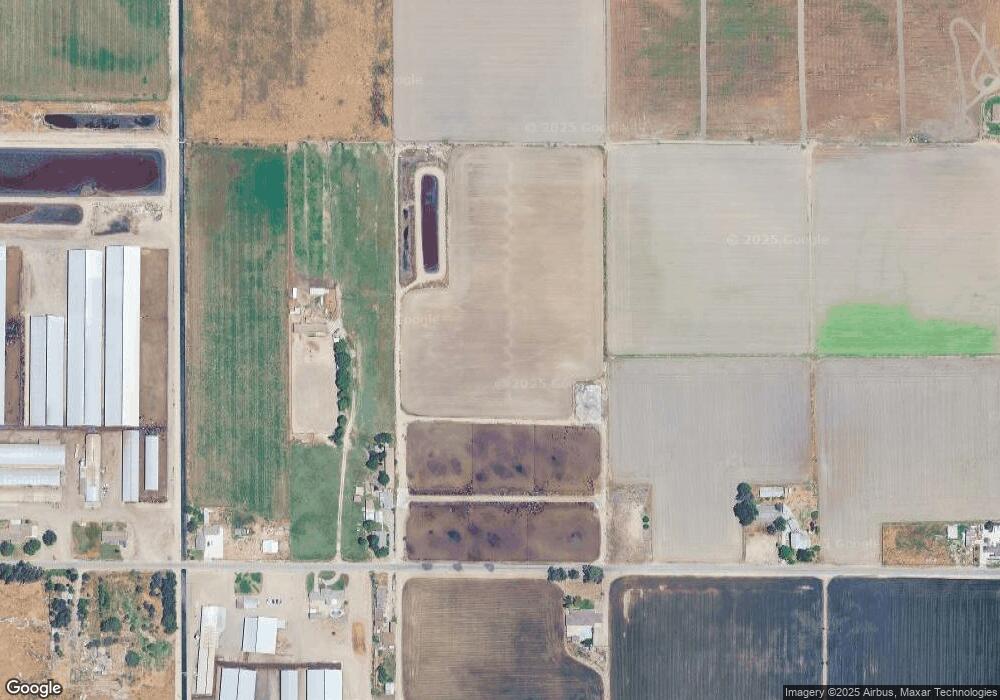
Map
Nearby Homes
- 13807 Carpenter Rd
- 16642 Hickory Ave
- 8631 Mitchell Rd
- 1237 W Keyes Rd
- 4701 S Faith Home Rd
- 1613 Fig Ave
- 5237 Crows Landing Rd
- 6425 S Prairie Flower Rd
- 1137 Apricot Ave
- 1736 S Washington Rd
- 18413 Sycamore Ave
- 1290 Orange Ave
- 4207 W Linwood Ave
- 1407 E Las Palmas Ave
- 16012 Sycamore Ave
- 2030 E Grayson Rd Unit 42
- 2030 E Grayson Rd Unit 44
- 2030 E Grayson Rd Unit 26
- 2030 E Grayson Rd Unit 41
- 4012 W Tuolumne Rd
- 601 Ruble Rd
- 600 Ruble Rd
- 624 Ruble Rd
- 724 Ruble Rd
- 406 Ruble Rd
- 731 Ruble Rd
- 534 Ruble Rd
- 337 Ruble Rd Unit A
- 807 Ruble Rd
- 842 Ruble Rd
- 225 Ruble Rd
- 1024 Ruble Rd
- 107 Ruble Rd
- 1018 Ruble Rd
- 10560 Crows Landing Rd
- 10442 Crows Landing Rd
- 10472 Crows Landing Rd
- 10400 Crows Landing Rd
- 10336 Crows Landing Rd
- 1124 Ruble Rd
Your Personal Tour Guide
Ask me questions while you tour the home.