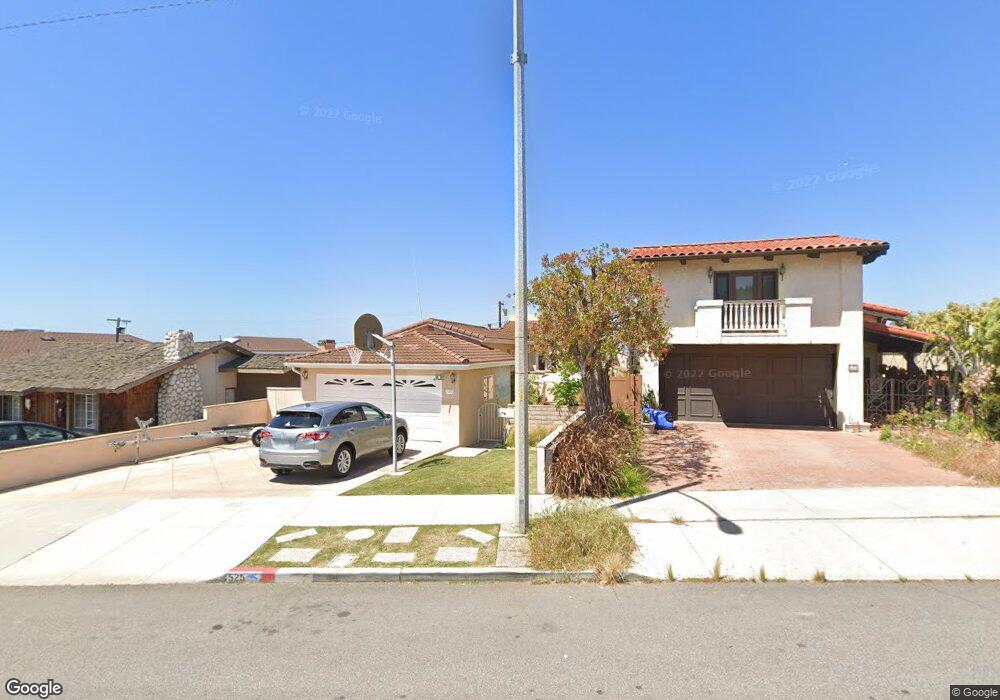
525 S Helberta Ave Redondo Beach, CA 90277
Estimated Value: $1,598,000 - $2,115,000
2
Beds
1
Bath
1,665
Sq Ft
$1,104/Sq Ft
Est. Value
About This Home
This home is located at 525 S Helberta Ave, Redondo Beach, CA 90277 and is currently estimated at $1,838,812, approximately $1,104 per square foot. 525 S Helberta Ave is a home located in Los Angeles County with nearby schools including Alta Vista Elementary School, Parras (Nick G.) Middle School, and Redondo Union High School.
Ownership History
Date
Name
Owned For
Owner Type
Purchase Details
Closed on
Oct 12, 2012
Sold by
Kittell Robert J
Bought by
Kittell Robert J and Kittell Janey L
Current Estimated Value
Purchase Details
Closed on
Dec 22, 2010
Sold by
Kittell Robert J
Bought by
Kittell Robert J and Kittel Janey L
Home Financials for this Owner
Home Financials are based on the most recent Mortgage that was taken out on this home.
Original Mortgage
$235,000
Interest Rate
4.71%
Mortgage Type
New Conventional
Purchase Details
Closed on
Dec 5, 2002
Sold by
Kittell Robert J
Bought by
Kittell Robert J and Kittell Janey L
Home Financials for this Owner
Home Financials are based on the most recent Mortgage that was taken out on this home.
Original Mortgage
$225,000
Interest Rate
6.06%
Purchase Details
Closed on
Sep 24, 2000
Sold by
Kittell Robert J
Bought by
Kittell Robert J and Kittell Janey L
Create a Home Valuation Report for This Property
The Home Valuation Report is an in-depth analysis detailing your home's value as well as a comparison with similar homes in the area
Home Values in the Area
Average Home Value in this Area
Purchase History
| Date | Buyer | Sale Price | Title Company |
|---|---|---|---|
| Kittell Robert J | -- | None Available | |
| Kittell Robert J | -- | None Available | |
| Kittell Robert J | -- | -- | |
| Kittell Robert J | -- | Equity Title | |
| Kittell Robert J | -- | -- |
Source: Public Records
Mortgage History
| Date | Status | Borrower | Loan Amount |
|---|---|---|---|
| Previous Owner | Kittell Robert J | $235,000 | |
| Previous Owner | Kittell Robert J | $225,000 |
Source: Public Records
Tax History Compared to Growth
Tax History
| Year | Tax Paid | Tax Assessment Tax Assessment Total Assessment is a certain percentage of the fair market value that is determined by local assessors to be the total taxable value of land and additions on the property. | Land | Improvement |
|---|---|---|---|---|
| 2025 | $2,832 | $184,701 | $80,391 | $104,310 |
| 2024 | $2,832 | $181,080 | $78,815 | $102,265 |
| 2023 | $2,792 | $177,530 | $77,270 | $100,260 |
| 2022 | $2,717 | $174,050 | $75,755 | $98,295 |
| 2021 | $2,692 | $170,638 | $74,270 | $96,368 |
| 2019 | $2,602 | $165,578 | $72,068 | $93,510 |
| 2018 | $2,471 | $162,332 | $70,655 | $91,677 |
| 2016 | $2,376 | $156,030 | $67,912 | $88,118 |
| 2015 | $2,341 | $153,687 | $66,892 | $86,795 |
| 2014 | $2,315 | $150,677 | $65,582 | $85,095 |
Source: Public Records
Map
Nearby Homes
- 512 S Gertruda Ave
- 619 Camino Real
- 626 Elvira Ave
- 515 S Broadway Unit B
- 427 S Broadway
- 510 S Catalina Ave Unit 2
- 641 S Gertruda Ave
- 620 S Catalina Ave Unit C
- 824 Camino Real Unit 106
- 830 Camino Real Unit 201
- 824 Camino Real Unit 101
- 810 Camino Real Unit 104
- 716 S Broadway Unit A
- 512 Esplanade Unit 303
- 603 S Prospect Ave Unit 205
- 603 S Prospect Ave Unit 305
- 724 S Broadway Unit B
- 641 S Prospect Ave Unit 103
- 635 S Prospect Ave Unit 103
- 221 S Guadalupe Ave
- 523 S Helberta Ave
- 527 S Helberta Ave
- 521 S Helberta Ave
- 529 S Helberta Ave
- 519 S Helberta Ave
- 526 S Gertruda Ave
- 524 S Gertruda Ave
- 531 S Helberta Ave
- 528 S Gertruda Ave
- 522 S Gertruda Ave
- 530 S Gertruda Ave
- 517 S Helberta Ave
- 520 S Gertruda Ave
- 533 S Helberta Ave
- 532 S Gertruda Ave
- 522 S Helberta Ave
- 524 S Helberta Ave
- 518 S Gertruda Ave
- 518 S Helberta Ave
- 520 S Helberta Ave