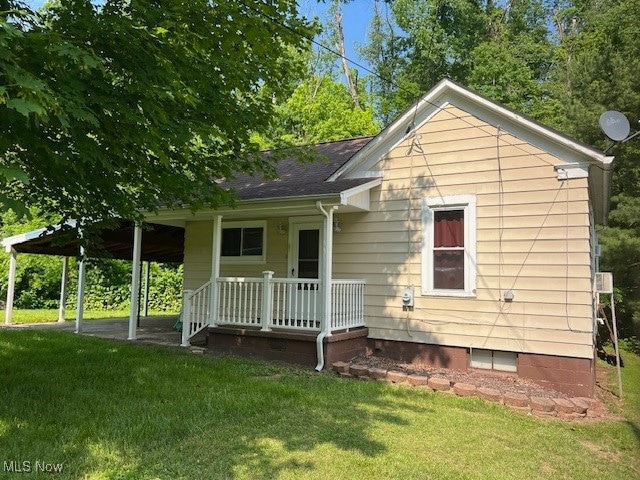
525 W 39th St Shadyside, OH 43947
Estimated payment $534/month
Highlights
- 0.33 Acre Lot
- No HOA
- 1 Attached Carport Space
- Jefferson Avenue Elementary School Rated A-
- Window Unit Cooling System
- Forced Air Heating System
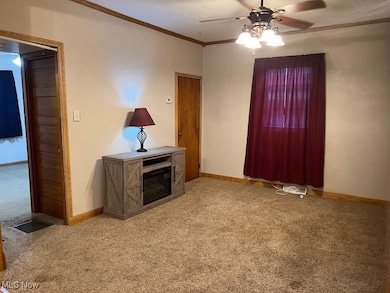
About This Home
Tired of paying rent? Buy this house and say goodbye to your landlord. Depending on your financing, it could be less than paying rent, and it's yours! If you're starting out or downsizing, this could be your new home! You will love the large flat front yard and the small babbling brook behind. It is a small creek but has never flooded, and the seller does not have to maintain flood insurance. However, the FEMA map shows that it is. Check with your bank to clarify. This Cozy house is clean and ready to move into. The seller says that the basement is dry after a repair was made a few years ago. The basement will be suitable for storage, and there is also a large shed. This cutie could be just what you have been waiting for at an affordable price. Here is your chance! Dont wait!
Listing Agent
Cedar One Realty Brokerage Email: kathyosovich@gmail.com, 304-215-3131 License #426739 Listed on: 06/27/2025
Home Details
Home Type
- Single Family
Est. Annual Taxes
- $1,008
Year Built
- Built in 1932
Lot Details
- 0.33 Acre Lot
- Lot Dimensions are 184x58
Home Design
- Block Foundation
- Asphalt Roof
- Block Exterior
- Vinyl Siding
Interior Spaces
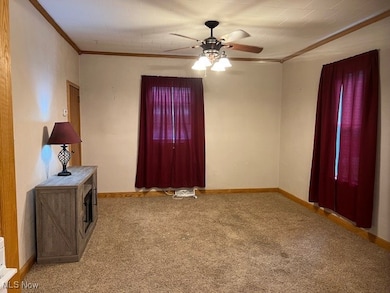
- 696 Sq Ft Home
- 1-Story Property
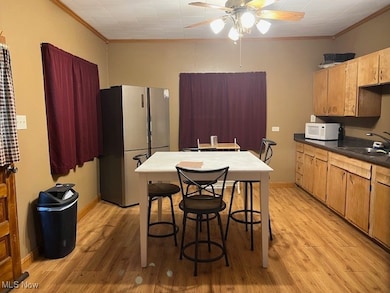
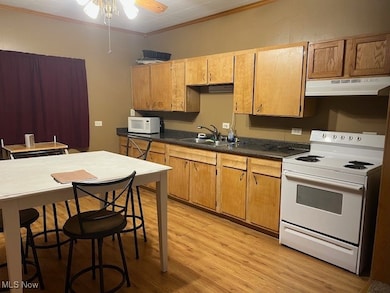
Kitchen
- Range
- Microwave
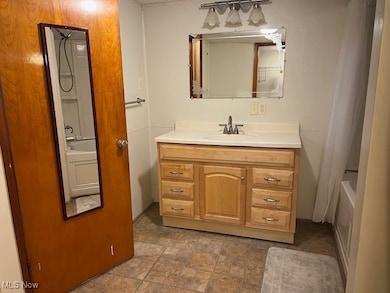
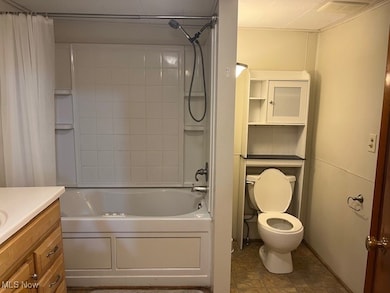
Bedrooms and Bathrooms
- 1 Main Level Bedroom
- 1 Full Bathroom
Laundry
- Dryer
- Washer
Basement
- Basement Fills Entire Space Under The House
- Laundry in Basement
Parking
- 1 Attached Carport Space
- Additional Parking
Utilities
- Window Unit Cooling System
- Forced Air Heating System
- Septic Tank
Community Details
- No Home Owners Association
- S Add Subdivision
Listing and Financial Details
- Assessor Parcel Number 17-00072-000
Map
Home Values in the Area
Average Home Value in this Area
Tax History
| Year | Tax Paid | Tax Assessment Tax Assessment Total Assessment is a certain percentage of the fair market value that is determined by local assessors to be the total taxable value of land and additions on the property. | Land | Improvement |
|---|---|---|---|---|
| 2024 | $1,010 | $25,210 | $7,370 | $17,840 |
| 2023 | $933 | $21,020 | $7,360 | $13,660 |
| 2022 | $933 | $21,021 | $7,364 | $13,657 |
| 2021 | $928 | $21,024 | $7,367 | $13,657 |
| 2020 | $809 | $17,970 | $6,300 | $11,670 |
| 2019 | $811 | $17,970 | $6,300 | $11,670 |
| 2018 | $791 | $17,970 | $6,300 | $11,670 |
| 2017 | $800 | $16,180 | $7,320 | $8,860 |
| 2016 | $804 | $16,180 | $7,320 | $8,860 |
| 2015 | $808 | $16,180 | $7,320 | $8,860 |
| 2014 | $826 | $16,180 | $6,660 | $9,520 |
| 2013 | $729 | $16,180 | $6,660 | $9,520 |
Property History
| Date | Event | Price | List to Sale | Price per Sq Ft |
|---|---|---|---|---|
| 09/03/2025 09/03/25 | Price Changed | $84,900 | -5.6% | $122 / Sq Ft |
| 06/27/2025 06/27/25 | For Sale | $89,900 | -- | $129 / Sq Ft |
Purchase History
| Date | Type | Sale Price | Title Company |
|---|---|---|---|
| Interfamily Deed Transfer | -- | Attorney | |
| Warranty Deed | $30,000 | Attorney | |
| Deed | $25,000 | -- | |
| Deed | -- | -- |
Mortgage History
| Date | Status | Loan Amount | Loan Type |
|---|---|---|---|
| Closed | $4,000 | Purchase Money Mortgage |
Source: MLS Now
MLS Number: 5135491
APN: 17-00072-000
Disclaimer: Certain information contained herein is derived from information provided by parties other than Homes.com. All information provided is deemed reliable, but is not guaranteed to be accurate and should be independently verified.
![]() IDX information is provided exclusively for personal, non-commercial use, and may not be used for any purpose other than to identify prospective properties consumers may be interested in purchasing. Information is deemed reliable but not guaranteed.
IDX information is provided exclusively for personal, non-commercial use, and may not be used for any purpose other than to identify prospective properties consumers may be interested in purchasing. Information is deemed reliable but not guaranteed.
- 473 W 39th St
- 3927 Daisyview St
- 225 W 40th St
- 3971 Grandview Ave
- 105 W 40th St
- 3871 Central Ave
- 3970 Central Ave
- 157 W 45th St
- 135 W 45th St
- 52 E 37th St
- 4410 Lincoln Ave
- 3480 Central Ave
- 3841 Grand Ave
- 3608 Lincoln Ave
- 4623 Lincoln Ave
- 3450 Elk Ave
- 3302 Central Ave
- 56612 McGee Rd
- 69 Julie Ct
- 27 16th St
- 20 E 36th St
- 2819 Gln Dl Hts Rd
- 503 32nd St Unit A
- 122 Cedar Ave Unit 122 Cedar U/S
- 2805 Glenwood Ave Unit Apartment 6
- 20 Highland Heights
- 4000 Eoff St
- 15 39th St
- 3801 Wetzel St
- 30 37th St
- 14 Elm Ln
- 29 Elm Ln
- 11 Milton Ln
- 2215 Market St Unit 2215 Market
- 93 Westgate Dr
- 1143 Main St
- 125 14th St Unit 6
- 1411 McColloch St Unit 2B
- 97 12th St Unit D
- 1 Zane St Unit 2
