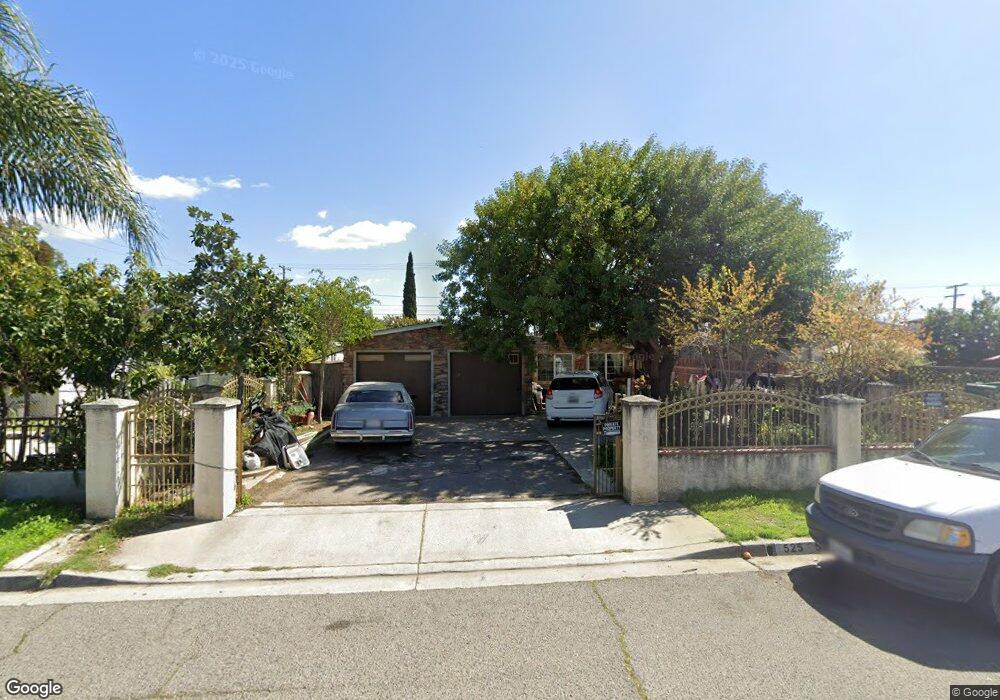
525 W 8th Ave Unit 27 Escondido, CA 92025
Central Escondido NeighborhoodEstimated Value: $707,000 - $885,000
4
Beds
2
Baths
1,360
Sq Ft
$575/Sq Ft
Est. Value
About This Home
This home is located at 525 W 8th Ave Unit 27, Escondido, CA 92025 and is currently estimated at $782,187, approximately $575 per square foot. 525 W 8th Ave Unit 27 is a home located in San Diego County with nearby schools including Felicita Elementary, Del Dios Academy of Arts & Sciences, and San Pasqual High School.
Ownership History
Date
Name
Owned For
Owner Type
Purchase Details
Closed on
Mar 7, 2019
Sold by
Moreno Jose R
Bought by
Moreno Alejandra and Moreno Jose R
Current Estimated Value
Home Financials for this Owner
Home Financials are based on the most recent Mortgage that was taken out on this home.
Original Mortgage
$307,285
Outstanding Balance
$266,836
Interest Rate
4.4%
Mortgage Type
FHA
Estimated Equity
$515,351
Purchase Details
Closed on
Feb 26, 2004
Sold by
Moreno Valentin
Bought by
Moreno Esperanza Baza
Purchase Details
Closed on
Oct 12, 2002
Sold by
Moreno Jose R and Felix Juan Moreno
Bought by
Moreno Jose R and Moreno Esperanza Baza
Purchase Details
Closed on
Sep 21, 1998
Sold by
Johnson John A and Johnson Carol L
Bought by
Moreno Jose R and Felix Juan Moreno
Home Financials for this Owner
Home Financials are based on the most recent Mortgage that was taken out on this home.
Original Mortgage
$105,675
Interest Rate
6.6%
Mortgage Type
FHA
Purchase Details
Closed on
Oct 14, 1985
Create a Home Valuation Report for This Property
The Home Valuation Report is an in-depth analysis detailing your home's value as well as a comparison with similar homes in the area
Home Values in the Area
Average Home Value in this Area
Purchase History
| Date | Buyer | Sale Price | Title Company |
|---|---|---|---|
| Moreno Alejandra | -- | Ticor Title Co San Diego | |
| Moreno Esperanza Baza | -- | Lawyers Title San Diego | |
| Moreno Jose R | -- | -- | |
| Moreno Jose R | $106,000 | Chicago Title | |
| -- | $80,000 | -- |
Source: Public Records
Mortgage History
| Date | Status | Borrower | Loan Amount |
|---|---|---|---|
| Open | Moreno Alejandra | $307,285 | |
| Previous Owner | Moreno Jose R | $105,675 |
Source: Public Records
Tax History
| Year | Tax Paid | Tax Assessment Tax Assessment Total Assessment is a certain percentage of the fair market value that is determined by local assessors to be the total taxable value of land and additions on the property. | Land | Improvement |
|---|---|---|---|---|
| 2025 | $3,427 | $303,669 | $192,410 | $111,259 |
| 2024 | $3,427 | $297,716 | $188,638 | $109,078 |
| 2023 | $3,349 | $291,880 | $184,940 | $106,940 |
| 2022 | $3,314 | $286,158 | $181,314 | $104,844 |
| 2021 | $3,260 | $280,548 | $177,759 | $102,789 |
| 2020 | $3,241 | $277,673 | $175,937 | $101,736 |
| 2019 | $3,083 | $272,230 | $172,488 | $99,742 |
| 2018 | $2,997 | $266,893 | $169,106 | $97,787 |
| 2017 | $2,027 | $181,361 | $96,160 | $85,201 |
| 2016 | $1,986 | $177,806 | $94,275 | $83,531 |
| 2015 | $1,968 | $175,136 | $92,859 | $82,277 |
| 2014 | $1,887 | $171,707 | $91,041 | $80,666 |
Source: Public Records
Map
Nearby Homes
- 752 W 9th Ave
- 222 W 8th Ave
- 211 W 9th Ave
- 801 W 11th Ave
- 328 Antoni Glen Unit 1006
- 127 W 5th Ave
- 803 Omar Dr
- 210 E 6th Ave
- 321 E 8th Ave
- 1305 Kiso Glen
- 204 E 2nd Ave
- 403-11 E 4th Ave
- 120 N Upas St
- 238-46 E 15th Ave
- 1027-33 Chestnut St
- 1019-25 Chestnut St
- 1019 Chestnut St
- 0 Via Ambiente Unit 170043393
- 0 Avenida Apice Unit NDP2508857
- 1564 Tanglewood Ln Unit 5
- 519 W 8th Ave Unit 21
- 535 W 8th Ave Unit 37
- 519 W 8th Ave
- 511 W 8th Ave Unit 13
- 543 W 8th Ave Unit 45
- 503 W 8th Ave
- 551 W 8th Ave Unit 59
- 534 W 9th Ave
- 534/536 W 9th
- 534 534 W 9th Ave
- 542 W 9th Ave
- 542 542 W 9th Ave
- 542/544 W 9th
- 548 W 9th Ave Unit 50
- 526 W 8th Ave
- 518 W 8th Ave
- 534 W 8th Ave
- 510 W 8th Ave
- 731 S Pine St Unit 33
- 550 W 8th Ave
Your Personal Tour Guide
Ask me questions while you tour the home.