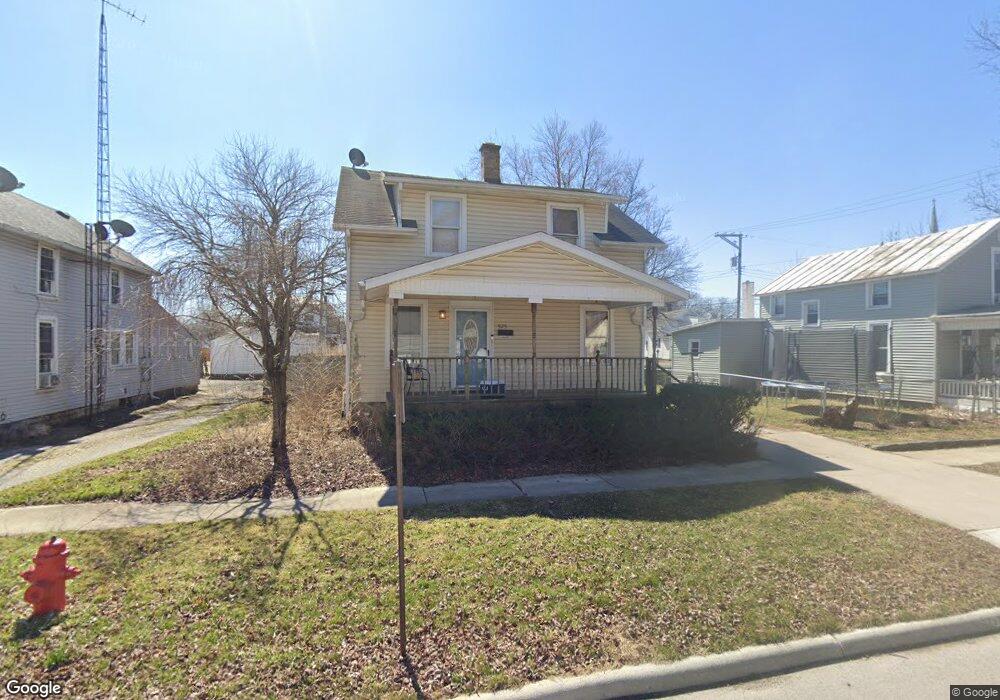
525 W Front St Findlay, OH 45840
Estimated Value: $102,000 - $128,000
--
Bed
1
Bath
1,014
Sq Ft
$111/Sq Ft
Est. Value
About This Home
This home is located at 525 W Front St, Findlay, OH 45840 and is currently estimated at $112,447, approximately $110 per square foot. 525 W Front St is a home located in Hancock County with nearby schools including Lincoln Elementary School, Donnell Middle School, and Findlay High School.
Ownership History
Date
Name
Owned For
Owner Type
Purchase Details
Closed on
Apr 19, 2024
Sold by
Peterson Angela and Peterson Rodney
Bought by
Peterson Riley
Current Estimated Value
Home Financials for this Owner
Home Financials are based on the most recent Mortgage that was taken out on this home.
Original Mortgage
$96,900
Outstanding Balance
$95,452
Interest Rate
6.88%
Mortgage Type
New Conventional
Estimated Equity
$16,995
Purchase Details
Closed on
Aug 8, 2003
Sold by
Corner Angela M
Bought by
Peterson Rodney and Peterson Angela
Home Financials for this Owner
Home Financials are based on the most recent Mortgage that was taken out on this home.
Original Mortgage
$83,500
Interest Rate
5.47%
Mortgage Type
Purchase Money Mortgage
Purchase Details
Closed on
Jul 5, 2001
Sold by
Gerschutz David M
Bought by
Angela M Corner
Purchase Details
Closed on
Jan 17, 1991
Bought by
Gerschutz Paul Francis
Create a Home Valuation Report for This Property
The Home Valuation Report is an in-depth analysis detailing your home's value as well as a comparison with similar homes in the area
Home Values in the Area
Average Home Value in this Area
Purchase History
| Date | Buyer | Sale Price | Title Company |
|---|---|---|---|
| Peterson Riley | $102,000 | Mid Am Title | |
| Peterson Rodney | -- | Quality Title Agency Inc | |
| Angela M Corner | $64,480 | -- | |
| Gerschutz Paul Francis | -- | -- |
Source: Public Records
Mortgage History
| Date | Status | Borrower | Loan Amount |
|---|---|---|---|
| Open | Peterson Riley | $96,900 | |
| Previous Owner | Peterson Rodney | $83,500 | |
| Closed | Angela M Corner | -- |
Source: Public Records
Tax History Compared to Growth
Tax History
| Year | Tax Paid | Tax Assessment Tax Assessment Total Assessment is a certain percentage of the fair market value that is determined by local assessors to be the total taxable value of land and additions on the property. | Land | Improvement |
|---|---|---|---|---|
| 2024 | $945 | $26,600 | $2,940 | $23,660 |
| 2023 | $946 | $26,600 | $2,940 | $23,660 |
| 2022 | $943 | $26,600 | $2,940 | $23,660 |
| 2021 | $957 | $23,500 | $2,940 | $20,560 |
| 2020 | $956 | $23,500 | $2,940 | $20,560 |
| 2019 | $937 | $23,500 | $2,940 | $20,560 |
| 2018 | $859 | $19,760 | $2,560 | $17,200 |
| 2017 | $430 | $19,760 | $2,560 | $17,200 |
| 2016 | $858 | $19,760 | $2,560 | $17,200 |
| 2015 | $776 | $17,750 | $2,280 | $15,470 |
| 2014 | $776 | $17,750 | $2,280 | $15,470 |
| 2012 | $749 | $16,980 | $3,400 | $13,580 |
Source: Public Records
Map
Nearby Homes
- 407 Washington St
- 514 Liberty St
- 419 W Lincoln St
- 0 Canadian Way Unit 20253551
- 0 Canadian Way Unit 6135400
- 720 S West St
- 512 N Cory St
- 213 Cherry St
- 224 Defiance Ave
- 225 Lima Ave
- 412 Lima Ave
- 416 1/2 Lima Ave
- 706 N Cory St
- 829 Maple Ave
- 1115 Liberty St
- 817 Park St
- 523 Center St
- 1005 Broad Ave
- 545 Clinton Ct
- 247 Crystal Ave
- 531 W Front St
- 523 W Front St
- 603 W Front St
- 519 W Front St
- 532 W Main Cross St
- 522 W Main Cross St
- 526 W Front St
- 602 W Main Cross St
- 605 W Front St
- 518 W Main Cross St
- 518 W Front St
- 607 W Front St
- 608 W Main Cross St
- 510 W Main Cross St
- 522 W Front St
- 509 W Front St
- 530 W Front St
- 611 W Front St
- 600 W Front St
- 608 W Front St