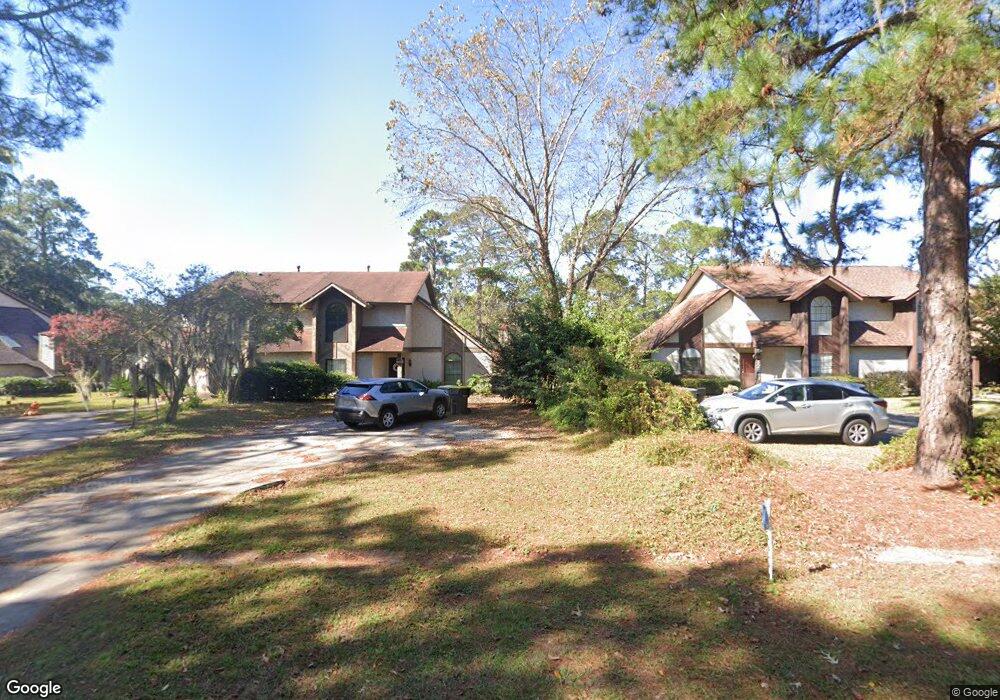
525 Windsor Rd Savannah, GA 31419
Windsor Forest NeighborhoodEstimated Value: $258,000
--
Bed
--
Bath
5,076
Sq Ft
$51/Sq Ft
Est. Value
About This Home
This home is located at 525 Windsor Rd, Savannah, GA 31419 and is currently priced at $258,000, approximately $50 per square foot. 525 Windsor Rd is a home located in Chatham County with nearby schools including Windsor Forest Elementary School, Windsor Forest High School, and Southwest Middle School.
Ownership History
Date
Name
Owned For
Owner Type
Purchase Details
Closed on
Jul 13, 2016
Bought by
Mayor Aldermen Of The
Current Estimated Value
Purchase Details
Closed on
Jun 17, 2014
Sold by
Morris Jimmy
Bought by
Paved Street Properties Llc
Purchase Details
Closed on
Nov 8, 2013
Sold by
Miltiades Helen
Bought by
Morris Jimmy
Purchase Details
Closed on
Jan 28, 2005
Sold by
Morris Jimmy
Bought by
Morris Jimmy and Miltiades Helen
Home Financials for this Owner
Home Financials are based on the most recent Mortgage that was taken out on this home.
Original Mortgage
$225,150
Interest Rate
5.72%
Mortgage Type
Commercial
Purchase Details
Closed on
Nov 4, 2004
Sold by
Gayheart Joseph L and Gayheart Alexandra H
Bought by
Si Properties Llc
Purchase Details
Closed on
Nov 2, 2004
Sold by
Si Properties Llc
Bought by
Morris Jimmy
Create a Home Valuation Report for This Property
The Home Valuation Report is an in-depth analysis detailing your home's value as well as a comparison with similar homes in the area
Home Values in the Area
Average Home Value in this Area
Purchase History
| Date | Buyer | Sale Price | Title Company |
|---|---|---|---|
| Mayor Aldermen Of The | $134,115 | -- | |
| Mayor Aldermen Of The | $218,900 | -- | |
| Paved Street Properties Llc | -- | -- | |
| Morris Jimmy | -- | -- | |
| Morris Jimmy | -- | -- | |
| Morris | -- | -- | |
| Morris Jimmy | -- | -- | |
| Si Properties Llc | $165,170 | -- | |
| Morris Jimmy | $1,000 | -- |
Source: Public Records
Mortgage History
| Date | Status | Borrower | Loan Amount |
|---|---|---|---|
| Previous Owner | Morris | $225,150 |
Source: Public Records
Tax History Compared to Growth
Tax History
| Year | Tax Paid | Tax Assessment Tax Assessment Total Assessment is a certain percentage of the fair market value that is determined by local assessors to be the total taxable value of land and additions on the property. | Land | Improvement |
|---|---|---|---|---|
| 2025 | $7,764 | $295,920 | $101,160 | $194,760 |
| 2024 | $7,764 | $268,600 | $101,160 | $167,440 |
| 2023 | $3,277 | $268,600 | $101,160 | $167,440 |
| 2022 | $3,277 | $268,600 | $101,160 | $167,440 |
| 2021 | $10,661 | $245,600 | $101,160 | $144,440 |
| 2020 | $10,471 | $0 | $0 | $0 |
| 2019 | $14,733 | $19,414 | $0 | $0 |
| 2018 | $10,470 | $331,600 | $151,640 | $179,960 |
| 2017 | $9,013 | $681,600 | $366,800 | $314,800 |
| 2016 | $8,967 | $307,360 | $124,560 | $182,800 |
| 2015 | -- | $740 | $0 | $0 |
| 2014 | -- | $379,600 | $0 | $0 |
Source: Public Records
Map
Nearby Homes
- 12726 Golf Club Dr
- 12608 Largo Dr
- 12841 Stillwood Dr
- 12825 Stillwood Dr
- 12823 Stillwood Dr
- 5 Birchwood Cove
- 324 Tanglewood Rd
- 602 Plantation Dr
- 406 Briarcliff Cir
- 518 Winwood Place
- 108 Greenbriar Dr
- 627 Northbrook Rd
- 13609 Rockingham Rd
- 149 Bordeaux Ln
- 317 Windsor Rd
- 138 Bordeaux Ln
- 214 Tanglewood Rd
- 118 Cedar Grove Rd
- 2 Lauren Ct
- 708 Windsor Rd
- 12714 Golf Club Dr
- 12716 Golf Club Dr
- 12710 Golf Club Dr
- 12718 Golf Club Dr
- 12713 Golf Club Dr
- 12708 Golf Club Dr
- 12720 Golf Club Dr
- 12715 Golf Club Dr
- 12705 Golf Club Dr
- 12722 Golf Club Dr
- 12706 Golf Club Dr
- 12701 Golf Club Dr
- 12719 Golf Club Dr
- 12521 Deerfield Rd
- 12704 Golf Club Dr
- 12724 Golf Club Dr
- 12519 Deerfield Rd
- 12721 Golf Club Dr
- 12702 Golf Club Dr
- 12517 Deerfield Rd