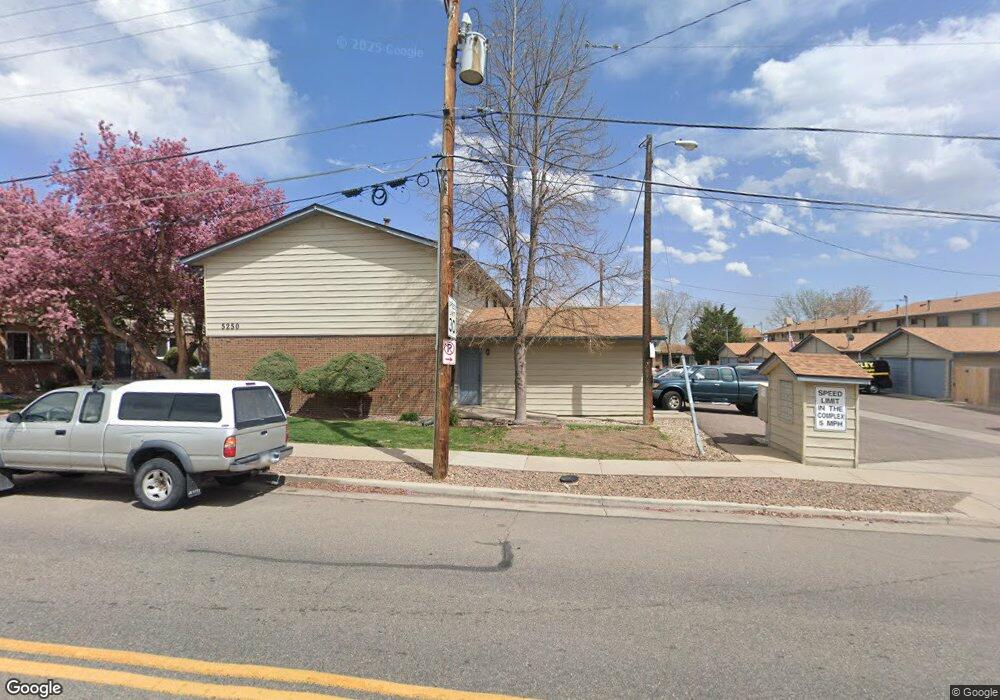
5250 Garrison St Unit 4 Arvada, CO 80002
Estimated Value: $333,861 - $388,000
2
Beds
2
Baths
972
Sq Ft
$364/Sq Ft
Est. Value
About This Home
This home is located at 5250 Garrison St Unit 4, Arvada, CO 80002 and is currently estimated at $353,965, approximately $364 per square foot. 5250 Garrison St Unit 4 is a home located in Jefferson County with nearby schools including Lawrence Elementary School, North Arvada Middle School, and Arvada High School.
Ownership History
Date
Name
Owned For
Owner Type
Purchase Details
Closed on
Mar 28, 2024
Sold by
Rodriguez Jose L and Jennings Lisa N
Bought by
Rodriguez Jose L
Current Estimated Value
Purchase Details
Closed on
Jul 23, 2021
Sold by
Equity Hunter Llc
Bought by
Rodriguez Jose L and Jennings Lisa N
Home Financials for this Owner
Home Financials are based on the most recent Mortgage that was taken out on this home.
Original Mortgage
$327,750
Interest Rate
2.96%
Mortgage Type
New Conventional
Purchase Details
Closed on
May 3, 2021
Sold by
Baysore & Christian Fiduciary Llc
Bought by
Hayes Teri L and Estate Of Julie Hyman Johnson
Create a Home Valuation Report for This Property
The Home Valuation Report is an in-depth analysis detailing your home's value as well as a comparison with similar homes in the area
Purchase History
| Date | Buyer | Sale Price | Title Company |
|---|---|---|---|
| Rodriguez Jose L | -- | None Listed On Document | |
| Rodriguez Jose L | $345,000 | Chicago Title | |
| Hayes Teri L | $245,100 | None Available |
Source: Public Records
Mortgage History
| Date | Status | Borrower | Loan Amount |
|---|---|---|---|
| Previous Owner | Rodriguez Jose L | $327,750 |
Source: Public Records
Tax History
| Year | Tax Paid | Tax Assessment Tax Assessment Total Assessment is a certain percentage of the fair market value that is determined by local assessors to be the total taxable value of land and additions on the property. | Land | Improvement |
|---|---|---|---|---|
| 2024 | $1,978 | $20,390 | $6,030 | $14,360 |
| 2023 | $1,978 | $20,390 | $6,030 | $14,360 |
| 2022 | $1,414 | $14,439 | $4,170 | $10,269 |
| 2021 | $1,437 | $14,854 | $4,290 | $10,564 |
| 2020 | $725 | $14,665 | $4,290 | $10,375 |
| 2019 | $715 | $14,665 | $4,290 | $10,375 |
| 2018 | $614 | $12,547 | $3,600 | $8,947 |
| 2017 | $562 | $12,547 | $3,600 | $8,947 |
| 2016 | $430 | $9,042 | $2,706 | $6,336 |
| 2015 | $360 | $9,042 | $2,706 | $6,336 |
| 2014 | $360 | $7,101 | $2,229 | $4,872 |
Source: Public Records
Map
Nearby Homes
- 9300 W 53rd Place
- 5126 Hoyt St
- 9309 Highland Place
- 5182 Estes Cir
- 8967 W 54th Place
- 9585 W 53rd Place
- 9000 Gyda Dr
- 5081 Garrison St Unit 9
- 5421 Field Ct
- 5211 Dover St
- 5031 Garrison St Unit 204C
- 5530 Holland Dr
- 5034 Everett St Unit 102
- 8735 W 54th Place
- 5140 Dover St
- 8530 W 52nd Ave Unit A3
- 5480 Dudley Ct
- 8742 W 49th Place
- 9340 W 49th Ave Unit 218
- 9340 W 49th Ave Unit 213
- 5250 Garrison St Unit 1
- 5250 Garrison St Unit 2
- 5250 Garrison St Unit 3
- 5250 Garrison St Unit 5
- 5250 Garrison St Unit 6
- 5250 Garrison St Unit 7
- 5250 Garrison St Unit 8
- 5250 Garrison St Unit 9
- 5250 Garrison St Unit 10
- 5250 Garrison St
- 5250 Garrison St Unit 66
- 5270 Garrison St Unit 10
- 5270 Garrison St Unit 9
- 5270 Garrison St Unit 8
- 5270 Garrison St Unit 7
- 5270 Garrison St Unit 6
- 5270 Garrison St Unit 5
- 5270 Garrison St Unit 4
- 5270 Garrison St Unit 3
- 5270 Garrison St Unit 2
Your Personal Tour Guide
Ask me questions while you tour the home.