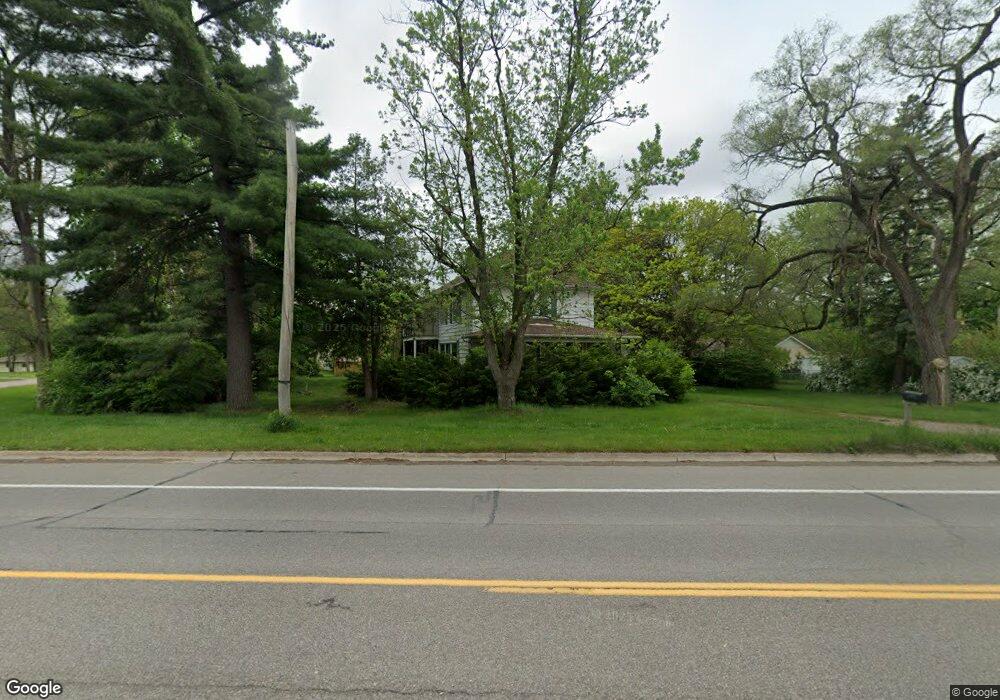
5251 Flushing Rd Flushing, MI 48433
Estimated Value: $250,000 - $299,000
5
Beds
3
Baths
3,200
Sq Ft
$85/Sq Ft
Est. Value
About This Home
This home is located at 5251 Flushing Rd, Flushing, MI 48433 and is currently estimated at $273,490, approximately $85 per square foot. 5251 Flushing Rd is a home located in Genesee County with nearby schools including Elms Elementary School, Flushing Middle School, and Flushing High School.
Ownership History
Date
Name
Owned For
Owner Type
Purchase Details
Closed on
Jun 11, 2010
Sold by
Scharrer Richard M and Scharrer Carol
Bought by
Mahan Sean
Current Estimated Value
Purchase Details
Closed on
Sep 1, 2008
Sold by
Scharrer Richard M and Scharrer Carol J
Bought by
Smith Karen Lynn
Home Financials for this Owner
Home Financials are based on the most recent Mortgage that was taken out on this home.
Original Mortgage
$146,500
Interest Rate
6.66%
Mortgage Type
Seller Take Back
Purchase Details
Closed on
Aug 28, 2008
Sold by
Fulton Joseph R
Bought by
Scharrer Richard Michael
Home Financials for this Owner
Home Financials are based on the most recent Mortgage that was taken out on this home.
Original Mortgage
$146,500
Interest Rate
6.66%
Mortgage Type
Seller Take Back
Purchase Details
Closed on
Mar 4, 2005
Sold by
Scharrer Richard M
Bought by
Fulton Joseph R
Purchase Details
Closed on
Sep 28, 1999
Sold by
Theriault Julius
Bought by
Revocable Trust Agreement Of Julius E Th
Create a Home Valuation Report for This Property
The Home Valuation Report is an in-depth analysis detailing your home's value as well as a comparison with similar homes in the area
Home Values in the Area
Average Home Value in this Area
Purchase History
| Date | Buyer | Sale Price | Title Company |
|---|---|---|---|
| Mahan Sean | $89,900 | First American Title Ins Co | |
| Smith Karen Lynn | $150,000 | None Available | |
| Scharrer Richard Michael | -- | None Available | |
| Fulton Joseph R | $100,000 | -- | |
| Revocable Trust Agreement Of Julius E Th | -- | -- |
Source: Public Records
Mortgage History
| Date | Status | Borrower | Loan Amount |
|---|---|---|---|
| Previous Owner | Smith Karen Lynn | $146,500 | |
| Closed | Fulton Joseph R | $0 |
Source: Public Records
Tax History
| Year | Tax Paid | Tax Assessment Tax Assessment Total Assessment is a certain percentage of the fair market value that is determined by local assessors to be the total taxable value of land and additions on the property. | Land | Improvement |
|---|---|---|---|---|
| 2025 | $2,880 | $124,800 | $0 | $0 |
| 2024 | $1,400 | $119,600 | $0 | $0 |
| 2023 | $1,440 | $96,800 | $0 | $0 |
| 2022 | $1,177 | $77,200 | $0 | $0 |
| 2021 | $2,329 | $72,000 | $0 | $0 |
| 2020 | $1,207 | $59,700 | $0 | $0 |
| 2019 | $1,197 | $55,200 | $0 | $0 |
| 2018 | $2,326 | $51,700 | $0 | $0 |
| 2017 | $1,869 | $51,700 | $0 | $0 |
| 2016 | $2,203 | $42,500 | $0 | $0 |
| 2015 | $1,515 | $42,500 | $0 | $0 |
| 2014 | $861 | $40,700 | $0 | $0 |
| 2012 | -- | $44,400 | $44,400 | $0 |
Source: Public Records
Map
Nearby Homes
- 2218 Disch St
- 2340 Pineview Ct
- 2372 Meadow St
- 2371 Pineview Ct
- 5442 Meadow Creek Ct
- 2008 Beekman Ct
- 5411 River Meadow Blvd
- 6123 E River Rd
- VL N Linden Rd
- 5021 Forest Side Dr
- 00 Emeraldwood Trail
- 74 Emeraldwood Trail
- 60 Emeraldwood Trail
- 3200 Amelia Ave
- 6273 Boulder Dr
- 1246 Dyemeadow Ln
- 6268 Boulder Dr
- 6551 River Rd
- 5551 Sugar Bush Ln
- 2365 Flagstone Dr
- 5251 Flushing Rd
- 2215 Francisco St
- 2226 Disch St
- 2234 Disch St
- 2222 Francisco St
- 2206 Disch St
- 2195 Francisco St
- 5219 Flushing Rd
- 5222 Flushing Rd
- 5242 Flushing Rd
- 5252 Flushing Rd
- 2196 Disch St
- 5256 Flushing Rd
- 2243 Disch St
- 5220 Flushing Rd
- 5264 Flushing Rd
- 2194 Francisco St
- 2229 Disch St
- 5268 Flushing Rd
- 2185 Francisco St
Your Personal Tour Guide
Ask me questions while you tour the home.