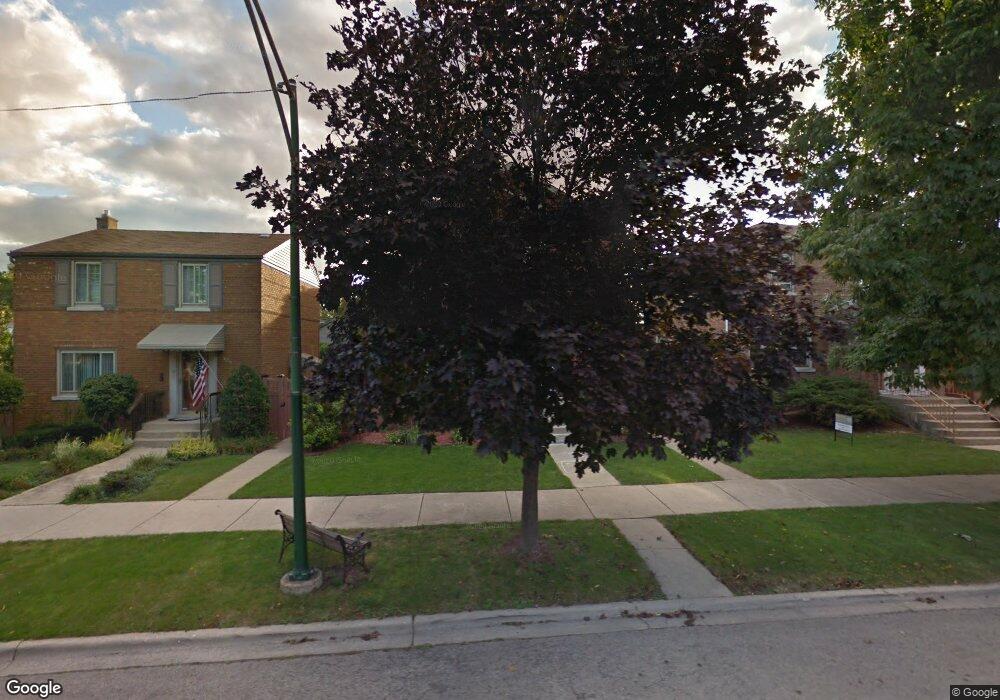
5251 S Mason Ave Chicago, IL 60638
Garfield Ridge NeighborhoodEstimated Value: $258,000 - $335,000
2
Beds
1
Bath
864
Sq Ft
$347/Sq Ft
Est. Value
About This Home
This home is located at 5251 S Mason Ave, Chicago, IL 60638 and is currently estimated at $299,438, approximately $346 per square foot. 5251 S Mason Ave is a home located in Cook County with nearby schools including Twain Elementary School, Kennedy High School, and Gloria Dei Lutheran School.
Ownership History
Date
Name
Owned For
Owner Type
Purchase Details
Closed on
Oct 10, 2008
Sold by
Mosqueda Angel G and Simmons Karen L
Bought by
Mosqueda Angel Gabriel and Simmons Karen Louise
Current Estimated Value
Purchase Details
Closed on
Apr 28, 2000
Sold by
Fundarek Timothy
Bought by
Mosqueda Angel G and Simmons Karen L
Home Financials for this Owner
Home Financials are based on the most recent Mortgage that was taken out on this home.
Original Mortgage
$142,400
Outstanding Balance
$49,195
Interest Rate
8.14%
Estimated Equity
$250,243
Purchase Details
Closed on
Mar 14, 1995
Sold by
Fundarek Shannon
Bought by
Fundarek Timothy
Purchase Details
Closed on
Nov 23, 1993
Sold by
Bucek Mildred E
Bought by
Fundarek Timothy J and Fundarek Shannon C
Home Financials for this Owner
Home Financials are based on the most recent Mortgage that was taken out on this home.
Original Mortgage
$89,300
Interest Rate
6.88%
Create a Home Valuation Report for This Property
The Home Valuation Report is an in-depth analysis detailing your home's value as well as a comparison with similar homes in the area
Home Values in the Area
Average Home Value in this Area
Purchase History
| Date | Buyer | Sale Price | Title Company |
|---|---|---|---|
| Mosqueda Angel Gabriel | -- | None Available | |
| Mosqueda Angel G | $150,000 | -- | |
| Fundarek Timothy | -- | -- | |
| Fundarek Timothy J | $62,666 | -- |
Source: Public Records
Mortgage History
| Date | Status | Borrower | Loan Amount |
|---|---|---|---|
| Open | Mosqueda Angel G | $142,400 | |
| Previous Owner | Fundarek Timothy J | $89,300 |
Source: Public Records
Tax History Compared to Growth
Tax History
| Year | Tax Paid | Tax Assessment Tax Assessment Total Assessment is a certain percentage of the fair market value that is determined by local assessors to be the total taxable value of land and additions on the property. | Land | Improvement |
|---|---|---|---|---|
| 2024 | $3,189 | $25,000 | $5,775 | $19,225 |
| 2023 | -- | $21,000 | $5,156 | $15,844 |
| 2022 | $0 | $21,000 | $5,156 | $15,844 |
| 2021 | $3,230 | $20,999 | $5,156 | $15,843 |
| 2020 | $3,230 | $17,508 | $4,125 | $13,383 |
| 2019 | $3,240 | $19,454 | $4,125 | $15,329 |
| 2018 | $3,185 | $19,454 | $4,125 | $15,329 |
| 2017 | $2,232 | $13,675 | $3,712 | $9,963 |
| 2016 | $2,254 | $13,675 | $3,712 | $9,963 |
| 2015 | $2,040 | $13,675 | $3,712 | $9,963 |
| 2014 | $1,966 | $13,085 | $3,506 | $9,579 |
| 2013 | $1,917 | $13,085 | $3,506 | $9,579 |
Source: Public Records
Map
Nearby Homes
- 5245 S Mayfield Ave
- 5128 S Meade Ave
- 5108 S Massasoit Ave
- 5417 S Melvina Ave Unit 102
- 5141 S Merrimac Ave
- 5253 S Mobile Ave
- 5533 S Menard Ave
- 5127 S Parkside Ave
- 5118 S Mobile Ave
- 5611 S Monitor Ave
- 5712 W 56th St
- 5121 S Central Ave
- 5421 S Mulligan Ave
- 5142 S Mulligan Ave
- 6340 S Archer Ave
- 5621 S Moody Ave
- 5107 S Luna Ave
- 5248 S Narragansett Ave
- 5053 S Luna Ave
- 5700 S Monitor Ave
- 5255 S Mason Ave
- 5259 S Mason Ave
- 5245 S Mason Ave
- 5241 S Mason Ave
- 5252 S Mayfield Ave
- 5248 S Mayfield Ave
- 5248 S Mayfield Ave
- 5237 S Mason Ave
- 5258 S Mayfield Ave
- 5301 S Mason Ave
- 5244 S Mayfield Ave
- 5240 S Mayfield Ave
- 5235 S Mason Ave
- 5305 S Mason Ave
- 5238 S Mayfield Ave
- 5250 S Mason Ave
- 5256 S Mason Ave
- 5246 S Mason Ave
- 5258 S Mason Ave
- 5300 S Mayfield Ave