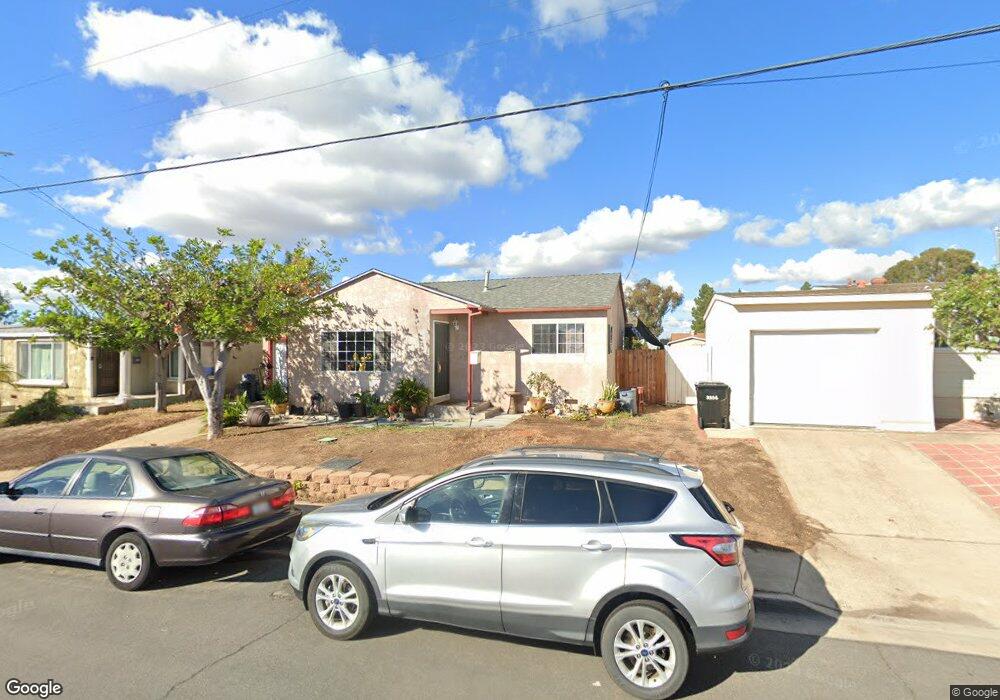
5252 Maple St San Diego, CA 92105
Oak Park NeighborhoodEstimated Value: $612,003 - $746,000
3
Beds
2
Baths
1,200
Sq Ft
$574/Sq Ft
Est. Value
About This Home
This home is located at 5252 Maple St, San Diego, CA 92105 and is currently estimated at $689,001, approximately $574 per square foot. 5252 Maple St is a home located in San Diego County with nearby schools including Oak Park Elementary School, Mann Middle School, and Crawford High School.
Ownership History
Date
Name
Owned For
Owner Type
Purchase Details
Closed on
Mar 7, 2019
Sold by
Velazquez Jesus and Roth Pamela
Bought by
Velazquez Jesus and Roth Pamela K
Current Estimated Value
Purchase Details
Closed on
Oct 15, 2015
Sold by
Roth Pamela K
Bought by
Velazquez Jesus and Velazquez Pamela Roth
Purchase Details
Closed on
May 26, 2005
Sold by
Velasquez Jesus and Roth Pamela Kay
Bought by
Roth Pamela Kay
Purchase Details
Closed on
May 29, 1996
Sold by
Johnsen Marjorie G Trust 04-24-90 and Marjorie G
Bought by
Velazquez Jesus and Roth Pamela Kay
Home Financials for this Owner
Home Financials are based on the most recent Mortgage that was taken out on this home.
Original Mortgage
$107,459
Outstanding Balance
$6,872
Interest Rate
8.01%
Mortgage Type
FHA
Estimated Equity
$682,129
Create a Home Valuation Report for This Property
The Home Valuation Report is an in-depth analysis detailing your home's value as well as a comparison with similar homes in the area
Home Values in the Area
Average Home Value in this Area
Purchase History
| Date | Buyer | Sale Price | Title Company |
|---|---|---|---|
| Velazquez Jesus | -- | None Available | |
| Velazquez Jesus | -- | None Available | |
| Roth Pamela Kay | -- | -- | |
| Velazquez Jesus | $108,500 | South Coast Title |
Source: Public Records
Mortgage History
| Date | Status | Borrower | Loan Amount |
|---|---|---|---|
| Open | Velazquez Jesus | $107,459 |
Source: Public Records
Tax History Compared to Growth
Tax History
| Year | Tax Paid | Tax Assessment Tax Assessment Total Assessment is a certain percentage of the fair market value that is determined by local assessors to be the total taxable value of land and additions on the property. | Land | Improvement |
|---|---|---|---|---|
| 2025 | $2,319 | $196,849 | $94,452 | $102,397 |
| 2024 | $2,319 | $192,990 | $92,600 | $100,390 |
| 2023 | $2,266 | $189,207 | $90,785 | $98,422 |
| 2022 | $2,204 | $185,498 | $89,005 | $96,493 |
| 2021 | $2,187 | $181,861 | $87,260 | $94,601 |
| 2020 | $2,160 | $179,997 | $86,366 | $93,631 |
| 2019 | $2,121 | $176,469 | $84,673 | $91,796 |
| 2018 | $1,982 | $173,010 | $83,013 | $89,997 |
| 2017 | $80 | $169,619 | $81,386 | $88,233 |
| 2016 | $1,900 | $166,294 | $79,791 | $86,503 |
| 2015 | $1,871 | $163,797 | $78,593 | $85,204 |
| 2014 | $1,841 | $160,589 | $77,054 | $83,535 |
Source: Public Records
Map
Nearby Homes
- 2151 54th St
- 2215 Susan Place
- 0 Redwood St Unit IG25200939
- 2501 2503 Sumac Dr
- 5550 Grape St
- 4918 Dalehaven Place
- 4927 Deaton Dr
- 2003 Bayview Heights Dr Unit SPC 109
- 2003 Bayview Heights Dr Unit SPC 210
- 2003 Bayview Heights Dr Unit 157
- 2003 Bayview Heights Dr Unit SPC 180
- 2003 Bayview Heights Dr Unit 176
- 2003 Bayview Heights Dr Unit 83
- 2877 47th St
- 1828 Oakshire Ct
- 4666 Home Ave Unit 68
- 4712 Home Ave
- 5474 Streamview Dr
- 1951 47th St Unit 69
- 1951 47th St Unit 118