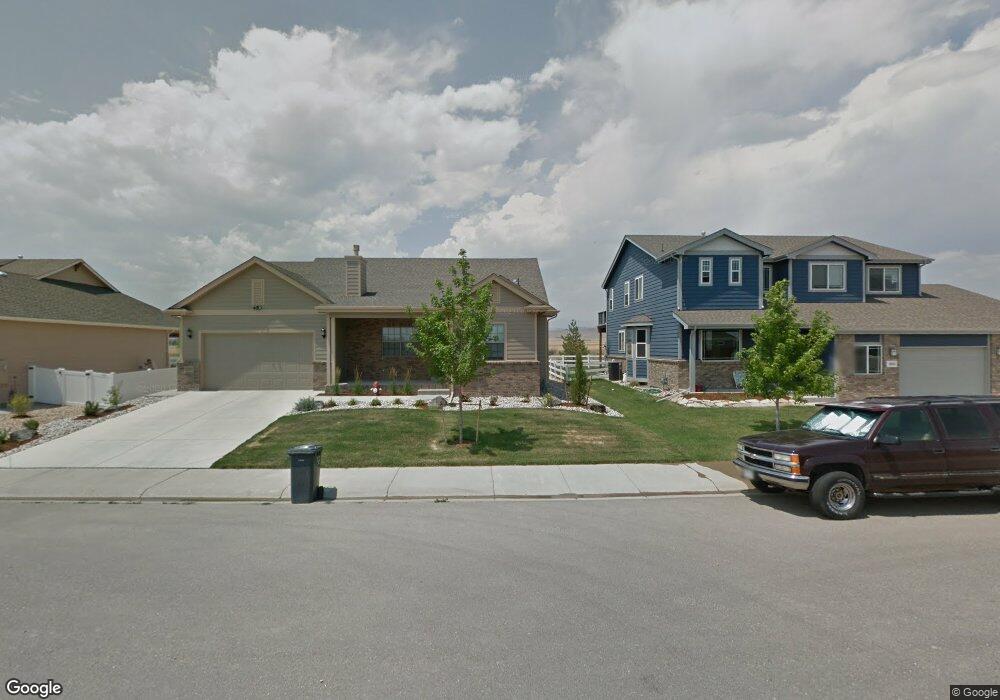
5253 Georgetown Dr Loveland, CO 80538
Estimated Value: $539,868 - $616,000
3
Beds
2
Baths
1,461
Sq Ft
$403/Sq Ft
Est. Value
About This Home
This home is located at 5253 Georgetown Dr, Loveland, CO 80538 and is currently estimated at $588,467, approximately $402 per square foot. 5253 Georgetown Dr is a home located in Larimer County with nearby schools including Centennial Elementary School, Lucile Erwin Middle School, and Loveland High School.
Ownership History
Date
Name
Owned For
Owner Type
Purchase Details
Closed on
Jul 13, 2020
Sold by
Andersen Benjamin I
Bought by
Andersen Benjamin I and Andersen Nichole Amber
Current Estimated Value
Home Financials for this Owner
Home Financials are based on the most recent Mortgage that was taken out on this home.
Original Mortgage
$306,000
Outstanding Balance
$271,341
Interest Rate
3.1%
Mortgage Type
New Conventional
Estimated Equity
$317,126
Purchase Details
Closed on
Dec 23, 2011
Sold by
Custom On Site Inc
Bought by
Andersen Benjamin I
Home Financials for this Owner
Home Financials are based on the most recent Mortgage that was taken out on this home.
Original Mortgage
$273,394
Interest Rate
3.75%
Mortgage Type
FHA
Purchase Details
Closed on
Aug 1, 2011
Sold by
Mack Ventures Llc
Bought by
Custom On Site Inc
Create a Home Valuation Report for This Property
The Home Valuation Report is an in-depth analysis detailing your home's value as well as a comparison with similar homes in the area
Home Values in the Area
Average Home Value in this Area
Purchase History
| Date | Buyer | Sale Price | Title Company |
|---|---|---|---|
| Andersen Benjamin I | -- | None Available | |
| Andersen Benjamin I | $284,935 | Heritage Title | |
| Custom On Site Inc | $60,000 | Fidelity National Title Insu |
Source: Public Records
Mortgage History
| Date | Status | Borrower | Loan Amount |
|---|---|---|---|
| Open | Andersen Benjamin I | $306,000 | |
| Closed | Andersen Benjamin I | $273,394 |
Source: Public Records
Tax History Compared to Growth
Tax History
| Year | Tax Paid | Tax Assessment Tax Assessment Total Assessment is a certain percentage of the fair market value that is determined by local assessors to be the total taxable value of land and additions on the property. | Land | Improvement |
|---|---|---|---|---|
| 2025 | $2,779 | $38,512 | $9,715 | $28,797 |
| 2024 | $2,681 | $38,512 | $9,715 | $28,797 |
| 2022 | $2,190 | $27,522 | $3,670 | $23,852 |
| 2021 | $2,250 | $28,314 | $3,775 | $24,539 |
| 2020 | $2,102 | $26,441 | $3,775 | $22,666 |
| 2019 | $2,067 | $26,441 | $3,775 | $22,666 |
| 2018 | $1,808 | $21,968 | $3,802 | $18,166 |
| 2017 | $1,557 | $21,968 | $3,802 | $18,166 |
| 2016 | $1,613 | $21,986 | $4,203 | $17,783 |
| 2015 | $1,599 | $21,980 | $4,200 | $17,780 |
| 2014 | $1,554 | $20,660 | $4,200 | $16,460 |
Source: Public Records
Map
Nearby Homes
- 5473 Segundo Dr
- 5586 Vona Dr
- 1866 Egnar St
- 5621 Segundo Dr
- 1889 La Salle Dr
- 1475 Massadona Place
- 1844 W 50th St
- 5061 Avon Ave
- 5049 Avon Ave
- 5445 Ault Dr
- Zion Plan at Eagle Brook Meadows
- 5037 Avon Ave
- Acadia Plan at Eagle Brook Meadows
- Glacier Plan at Eagle Brook Meadows
- Sequoia Plan at Eagle Brook Meadows
- Rainier Plan at Eagle Brook Meadows
- Pike Plan at Eagle Brook Meadows
- 5001 Avon Ave
- 1734 W 50th St
- 5042 Stonewall St
- 5241 Georgetown Dr
- 5265 Georgetown Dr
- 5229 Georgetown Dr
- 5250 Georgetown Dr
- 1553 Wetland St
- 5217 Georgetown Dr
- 1541 Timberland St
- 1530 Wetland St
- 5270 Georgetown Dr
- 1529 Wetland St
- 1529 Timberland St
- 5205 Georgetown Dr
- 1518 Wetland St
- 1542 Timberland St
- 1517 Wetland St
- 1517 Timberland St
- 1752 La Salle Dr
- 1764 La Salle Dr
- 1740 La Salle Dr
- 1530 Timberland St