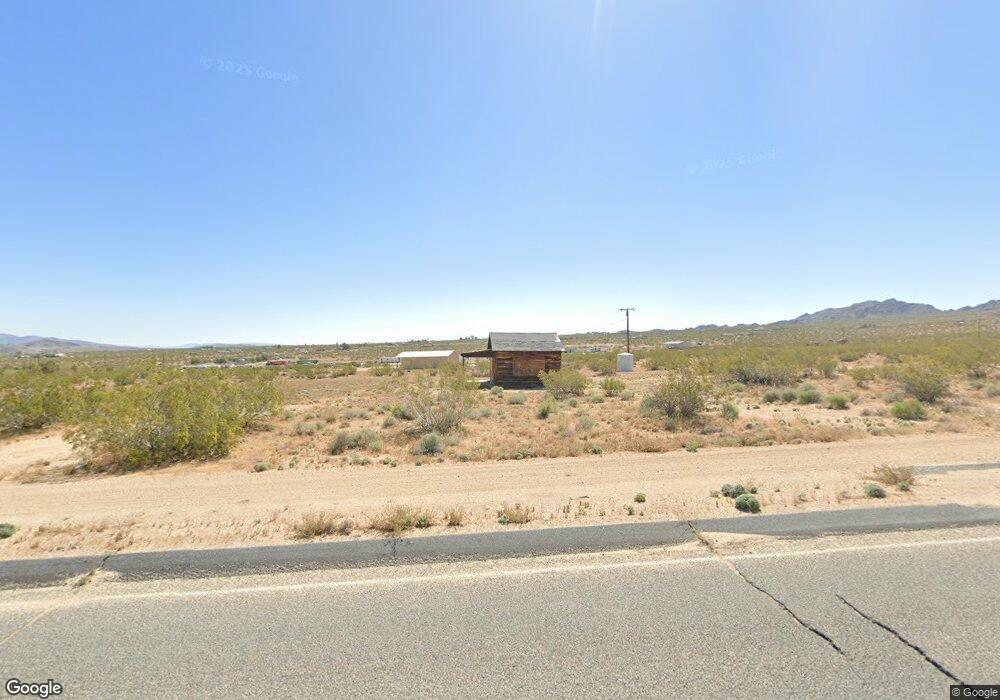
5253 Larrea Rd Johnson Valley, CA 92285
Estimated Value: $55,922 - $129,000
--
Bed
--
Bath
448
Sq Ft
$233/Sq Ft
Est. Value
About This Home
This home is located at 5253 Larrea Rd, Johnson Valley, CA 92285 and is currently estimated at $104,231, approximately $232 per square foot. 5253 Larrea Rd is a home located in San Bernardino County with nearby schools including Lucerne Valley Elementary School, Lucerne Valley Middle School, and Lucerne Valley High School.
Ownership History
Date
Name
Owned For
Owner Type
Purchase Details
Closed on
Jan 26, 2024
Sold by
Clabaugh Jimmy and Clabaugh Shelly
Bought by
Clabaugh Family Living Trust and Clabaugh
Current Estimated Value
Purchase Details
Closed on
Mar 24, 2009
Sold by
Leuschner Paul R
Bought by
Clabaugh Jimmy and Clabaugh Shelly
Purchase Details
Closed on
May 15, 2006
Sold by
Leuschner Paul R
Bought by
Leuschner Paul R and Leuschner Revocable Trust
Purchase Details
Closed on
Apr 7, 2003
Sold by
Iverson Stephen J
Bought by
Leuschner Paul R and Leuschner Robyn L
Purchase Details
Closed on
Oct 18, 1996
Sold by
Iverson Ardythe J and Iverson Stephen J
Bought by
Iverson Stephen J and Iverson Ardythe J
Purchase Details
Closed on
Oct 13, 1995
Sold by
Iverson Stephen J
Bought by
Iverson Stephen J and Iverson Ardythe J
Create a Home Valuation Report for This Property
The Home Valuation Report is an in-depth analysis detailing your home's value as well as a comparison with similar homes in the area
Home Values in the Area
Average Home Value in this Area
Purchase History
| Date | Buyer | Sale Price | Title Company |
|---|---|---|---|
| Clabaugh Family Living Trust | -- | None Listed On Document | |
| Clabaugh Jimmy | $30,000 | Fidelity National Title | |
| Leuschner Paul R | -- | None Available | |
| Leuschner Paul R | $5,000 | Stewart Title Company | |
| Iverson Stephen J | -- | -- | |
| Iverson Stephen J | -- | -- |
Source: Public Records
Tax History Compared to Growth
Tax History
| Year | Tax Paid | Tax Assessment Tax Assessment Total Assessment is a certain percentage of the fair market value that is determined by local assessors to be the total taxable value of land and additions on the property. | Land | Improvement |
|---|---|---|---|---|
| 2025 | $659 | $38,634 | $25,756 | $12,878 |
| 2024 | $659 | $37,876 | $25,251 | $12,625 |
| 2023 | $648 | $37,133 | $24,756 | $12,377 |
| 2022 | $633 | $36,405 | $24,271 | $12,134 |
| 2021 | $621 | $35,691 | $23,795 | $11,896 |
| 2020 | $611 | $35,325 | $23,551 | $11,774 |
| 2019 | $634 | $34,632 | $23,089 | $11,543 |
| 2018 | $473 | $33,953 | $22,636 | $11,317 |
| 2017 | $465 | $33,287 | $22,192 | $11,095 |
| 2016 | $456 | $32,634 | $21,757 | $10,877 |
| 2015 | $451 | $32,144 | $21,430 | $10,714 |
| 2014 | $448 | $31,514 | $21,010 | $10,504 |
Source: Public Records
Map
Nearby Homes
- 766 Quail Bush Rd
- 779 Quail Bush Rd
- 5457 Larrea Rd
- 50471 Cholla Rd
- 4852 Rock Corral Rd
- 0 Joshua Tree Rd Unit IV25160143
- 0 Joshua Tree Rd Unit IG25042001
- 4650 Sizer Canyon Rd
- 702 Bell Rd
- 5655 Last Mile Rd
- 0 Valley Vista Unit SW25116449
- 51474 Mills Rd
- 51360 Desert View Ln
- 774 Manzanita Rd
- 775 Manzanita Rd
- 0 Amargo Rd Unit JT25123517
- 0 Saddle Rock Way Unit SW25116459
- 0 Easton Rd Unit JT25097780
- 0 Easton Rd Unit SW24134801
- 0 Castillo Rd Unit SR25092809
- 0 Larrea Rd Unit IG14258342
- 50575 Ocotillo Rd
- 0 Ocotillo Rd Unit JT18200364
- 0 Ocotillo Rd Unit JT18025299
- 0 Ocotillo Rd Unit JT18021365
- 0 Ocotillo Rd Unit CRJT25014135
- 0 Ocotillo Rd Unit JT25014135
- 52000 Ocotillo Rd
- 0 Ocotillo Rd Unit OC24162232
- 0 Ocotillo Rd Unit JT22189971
- 0 Ocotillo Rd Unit JT22188010
- 0 Ocotillo Rd Unit 21321533
- 111 Ocotillo Rd
- 0 Ocotillo Rd Unit 219066151
- 0 Ocotillo Rd Unit JT20168739
- 0 Ocotillo Rd Unit JT20025613
- 0 Ocotillo Rd Unit JT20020404
- 0 Ocotillo Rd Unit JT18199563
- 0 Ocotillo Rd Unit SB16134120
- 0 Ocotillo Rd Unit JT19248097