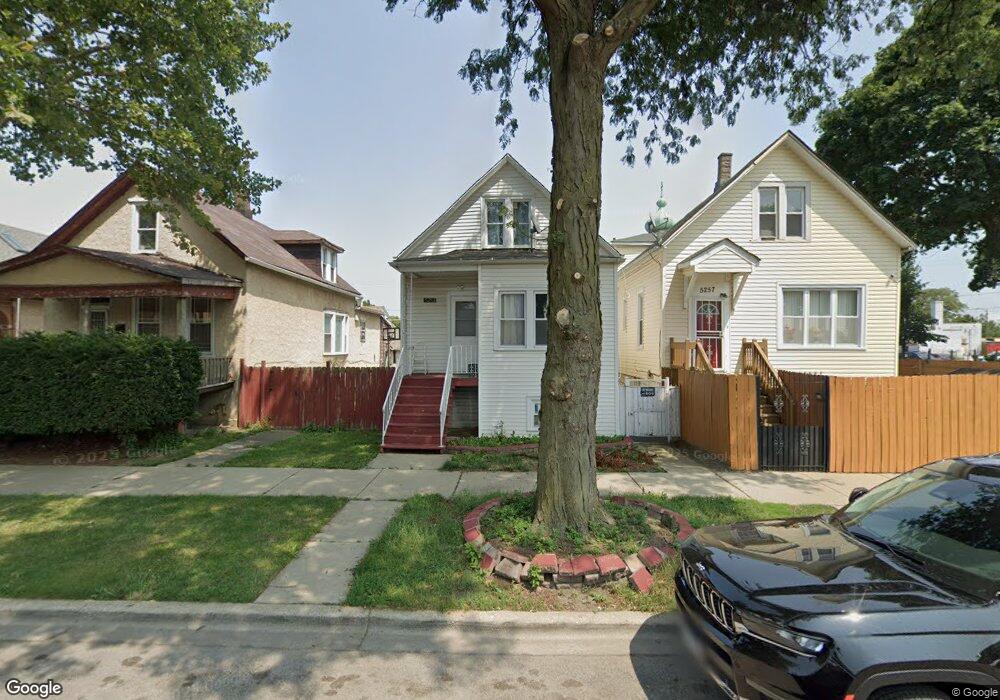
5253 S Artesian Ave Chicago, IL 60632
Gage Park NeighborhoodEstimated Value: $210,445 - $235,000
2
Beds
3
Baths
680
Sq Ft
$328/Sq Ft
Est. Value
About This Home
This home is located at 5253 S Artesian Ave, Chicago, IL 60632 and is currently estimated at $222,815, approximately $327 per square foot. 5253 S Artesian Ave is a home located in Cook County with nearby schools including Nightingale Elementary School, Kelly High School, and Horizon Science Academy – Southwest Chicago.
Ownership History
Date
Name
Owned For
Owner Type
Purchase Details
Closed on
Nov 15, 2018
Sold by
Diaz Jose C and Diaz Bertha A
Bought by
Castillo Vilchis Rodea Margarito and Castillo Baltazar Margarita
Current Estimated Value
Home Financials for this Owner
Home Financials are based on the most recent Mortgage that was taken out on this home.
Original Mortgage
$66,400
Outstanding Balance
$42,605
Interest Rate
5.37%
Mortgage Type
New Conventional
Estimated Equity
$180,210
Purchase Details
Closed on
Mar 14, 1995
Sold by
Diaz Daniel
Bought by
Diaz Jose C and Diaz Bertha A
Home Financials for this Owner
Home Financials are based on the most recent Mortgage that was taken out on this home.
Original Mortgage
$53,000
Interest Rate
7.07%
Purchase Details
Closed on
Mar 1, 1995
Sold by
Mccann James
Bought by
Diaz Jose C and Diaz Daniel
Home Financials for this Owner
Home Financials are based on the most recent Mortgage that was taken out on this home.
Original Mortgage
$53,000
Interest Rate
7.07%
Create a Home Valuation Report for This Property
The Home Valuation Report is an in-depth analysis detailing your home's value as well as a comparison with similar homes in the area
Home Values in the Area
Average Home Value in this Area
Purchase History
| Date | Buyer | Sale Price | Title Company |
|---|---|---|---|
| Castillo Vilchis Rodea Margarito | $83,000 | Chicago Title Insurance Comp | |
| Diaz Jose C | -- | -- | |
| Diaz Jose C | $58,000 | Ticor Title Insurance |
Source: Public Records
Mortgage History
| Date | Status | Borrower | Loan Amount |
|---|---|---|---|
| Open | Castillo Vilchis Rodea Margarito | $66,400 | |
| Previous Owner | Diaz Jose C | $53,000 |
Source: Public Records
Tax History Compared to Growth
Tax History
| Year | Tax Paid | Tax Assessment Tax Assessment Total Assessment is a certain percentage of the fair market value that is determined by local assessors to be the total taxable value of land and additions on the property. | Land | Improvement |
|---|---|---|---|---|
| 2024 | $1,312 | $15,001 | $1,363 | $13,638 |
| 2023 | $1,257 | $9,500 | $2,316 | $7,184 |
| 2022 | $1,257 | $9,500 | $2,316 | $7,184 |
| 2021 | $1,240 | $9,499 | $2,316 | $7,183 |
| 2020 | $1,582 | $10,157 | $2,316 | $7,841 |
| 2019 | $2,308 | $11,413 | $2,316 | $9,097 |
| 2018 | $2,269 | $11,413 | $2,316 | $9,097 |
| 2017 | $2,258 | $10,419 | $2,043 | $8,376 |
| 2016 | $2,101 | $10,419 | $2,043 | $8,376 |
| 2015 | $1,923 | $10,419 | $2,043 | $8,376 |
| 2014 | $1,831 | $9,793 | $1,907 | $7,886 |
| 2013 | $1,795 | $9,793 | $1,907 | $7,886 |
Source: Public Records
Map
Nearby Homes
- 5207 S Artesian Ave
- 5229 S Campbell Ave
- 5217 S Campbell Ave
- 5243 S Maplewood Ave
- 5142 S Campbell Ave
- 5247 S Rockwell St
- 5043 S Artesian Ave
- 2309 W 50th Place
- 5235 S Washtenaw Ave
- 4956 S Campbell Ave
- 5119 S Washtenaw Ave
- 2208 W 54th Place
- 2103 W 52nd St
- 2050 W 52nd St
- 5015 S Fairfield Ave
- 2453 W 56th St Unit 1
- 5330 S California Ave
- 5626 S Maplewood Ave
- 2040 W Garfield Blvd
- 5603 S Hamilton Ave
- 5257 S Artesian Ave
- 5251 S Artesian Ave
- 5247 S Artesian Ave
- 5243 S Artesian Ave
- 5241 S Artesian Ave
- 5301 S Artesian Ave
- 2417 W 53rd St Unit 1
- 2417 W 53rd St
- 5239 S Artesian Ave
- 5303 S Artesian Ave
- 5244 S Western Ave
- 5237 S Artesian Ave
- 5252 S Artesian Ave
- 5250 S Artesian Ave
- 5258 S Artesian Ave
- 5258 S Artesian Ave
- 5307 S Artesian Ave
- 5248 S Artesian Ave
- 5300 S Western Ave
- 5246 S Artesian Ave