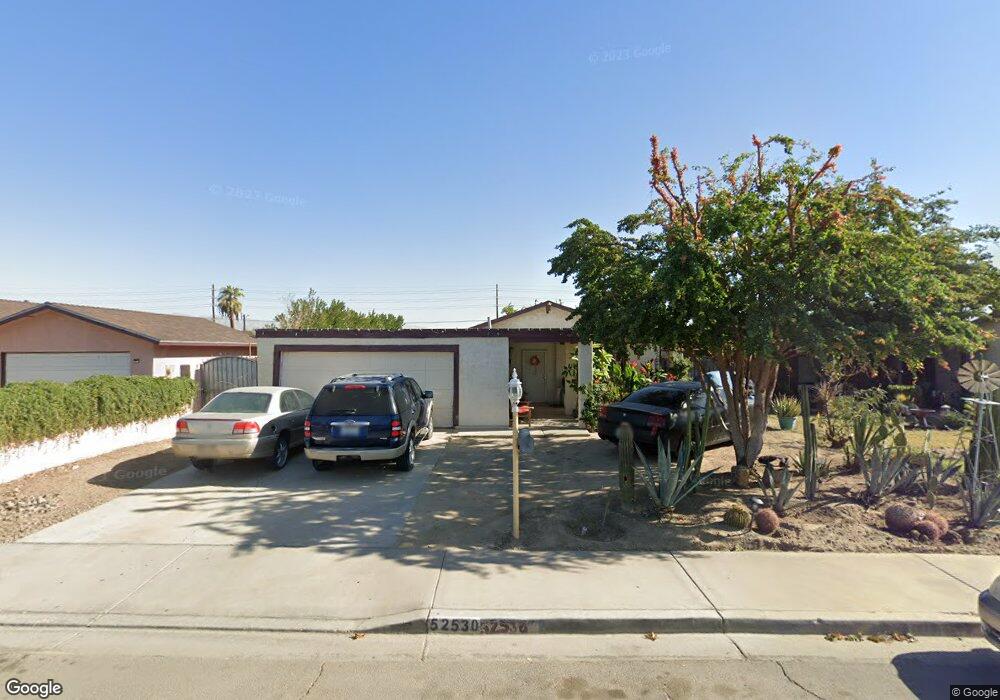
52530 Cypress St Coachella, CA 92236
Estimated Value: $256,000 - $383,000
3
Beds
2
Baths
1,120
Sq Ft
$308/Sq Ft
Est. Value
About This Home
This home is located at 52530 Cypress St, Coachella, CA 92236 and is currently estimated at $344,862, approximately $307 per square foot. 52530 Cypress St is a home located in Riverside County with nearby schools including Valley View Elementary School, Bobby Duke Middle School, and Coachella Valley High School.
Ownership History
Date
Name
Owned For
Owner Type
Purchase Details
Closed on
Oct 13, 2006
Sold by
Cortez Salvador R
Bought by
Cortez Salvador R and Cortez Belinda
Current Estimated Value
Home Financials for this Owner
Home Financials are based on the most recent Mortgage that was taken out on this home.
Original Mortgage
$134,000
Interest Rate
6.46%
Mortgage Type
New Conventional
Purchase Details
Closed on
Oct 30, 2000
Sold by
Cortez Petra and Sandoval Jose A
Bought by
Cortez Salvador R and Cortez Belinda
Home Financials for this Owner
Home Financials are based on the most recent Mortgage that was taken out on this home.
Original Mortgage
$94,500
Interest Rate
7.88%
Mortgage Type
FHA
Purchase Details
Closed on
Mar 24, 1994
Sold by
Cortez Petra and Sandoval Jose A
Bought by
Cortez Petra and Sandoval Jose A
Home Financials for this Owner
Home Financials are based on the most recent Mortgage that was taken out on this home.
Original Mortgage
$60,320
Interest Rate
7.15%
Mortgage Type
FHA
Create a Home Valuation Report for This Property
The Home Valuation Report is an in-depth analysis detailing your home's value as well as a comparison with similar homes in the area
Home Values in the Area
Average Home Value in this Area
Purchase History
| Date | Buyer | Sale Price | Title Company |
|---|---|---|---|
| Cortez Salvador R | -- | Accommodation | |
| Cortez Salvador R | -- | New Century Title Company Sa | |
| Cortez Salvador R | -- | Stewart Title Company | |
| Cortez Petra | -- | Northern Counties Title |
Source: Public Records
Mortgage History
| Date | Status | Borrower | Loan Amount |
|---|---|---|---|
| Closed | Cortez Salvador R | $134,000 | |
| Closed | Cortez Salvador R | $94,500 | |
| Closed | Cortez Petra | $60,320 |
Source: Public Records
Tax History Compared to Growth
Tax History
| Year | Tax Paid | Tax Assessment Tax Assessment Total Assessment is a certain percentage of the fair market value that is determined by local assessors to be the total taxable value of land and additions on the property. | Land | Improvement |
|---|---|---|---|---|
| 2025 | $2,614 | $124,667 | $30,438 | $94,229 |
| 2023 | $2,614 | $119,828 | $29,257 | $90,571 |
| 2022 | $2,507 | $117,480 | $28,684 | $88,796 |
| 2021 | $2,457 | $115,177 | $28,122 | $87,055 |
| 2020 | $2,373 | $113,997 | $27,834 | $86,163 |
| 2019 | $2,306 | $111,763 | $27,289 | $84,474 |
| 2018 | $2,249 | $109,572 | $26,755 | $82,817 |
| 2017 | $2,194 | $107,425 | $26,231 | $81,194 |
| 2016 | $2,112 | $105,319 | $25,717 | $79,602 |
| 2015 | $2,047 | $103,739 | $25,332 | $78,407 |
| 2014 | $1,538 | $101,709 | $24,837 | $76,872 |
Source: Public Records
Map
Nearby Homes
- 52066 Channing Ct
- 0 52nd Ave Unit 219131177DA
- 83904 52nd Ave
- 52313 Calle Alicia
- 85675 Michelle Dr
- 51812 Sunset Dr
- 53079 Cesar Chavez St
- 53175 Cesar Chavez St
- 53049 Cesar Chavez St
- 50529 Grapefruit Blvd
- 0 Damascus Ave
- 85158 Avenida Tacuba
- 52717 Calle Techa
- 53956 Corte Del Roble
- 0 Palm Ave
- 53020 Torino Place
- 52560 Tyler St
- 1449 3rd St
- 84640 Avenue 54
- 1423 2nd St
- 52560 Cypress St
- 52500 Cypress St
- 85457 Valley Rd
- 52590 Cypress St
- 85458 Valencia Ln
- 85469 Valley Rd
- 85433 Valley Rd
- 85470 Valencia Ln
- 85434 Valencia Ln
- 52488 Cypress St
- 52489 Cypress St
- 85481 Valley Rd
- 52487 Shady Ln
- 85428 Valencia Ln
- 85480 Valencia Ln
- 52487 Cypress St
- 52466 Cypress St
- 85421 Valley Rd
- 85451 Valencia Ln
- 85445 Valencia Ln