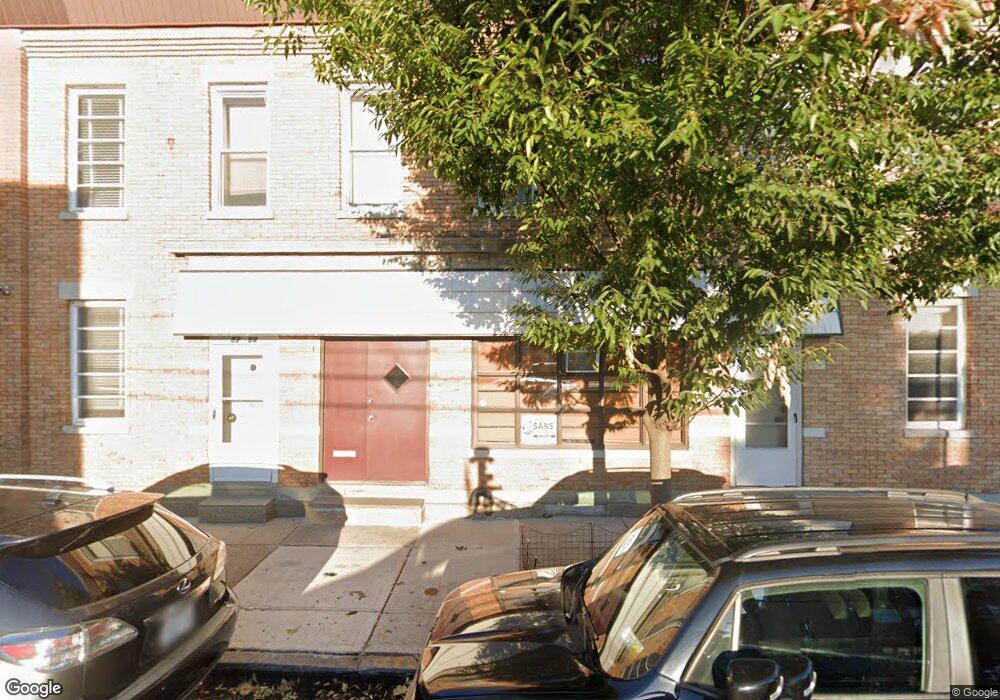
5254 72nd St Flushing, NY 11378
Maspeth NeighborhoodEstimated Value: $1,955,467
Studio
--
Bath
6,500
Sq Ft
$301/Sq Ft
Est. Value
About This Home
This home is located at 5254 72nd St, Flushing, NY 11378 and is currently estimated at $1,955,467, approximately $300 per square foot. 5254 72nd St is a home located in Queens County with nearby schools including P.S. 229 Emanuel Kaplan, IS 73 - The Frank Sansivieri School, and Grover Cleveland High School.
Ownership History
Date
Name
Owned For
Owner Type
Purchase Details
Closed on
Apr 20, 2023
Sold by
Taormina Associates Ltd
Bought by
Martos 72 Llc
Current Estimated Value
Purchase Details
Closed on
Jun 24, 2005
Sold by
Taormina Geraldine and Taormina Guy T
Bought by
Taormina Associates Ltd
Purchase Details
Closed on
Nov 10, 2004
Sold by
Estate Of Joseph Taormina
Bought by
Estate Of May Taormina and Geraldine Taormina As
Create a Home Valuation Report for This Property
The Home Valuation Report is an in-depth analysis detailing your home's value as well as a comparison with similar homes in the area
Home Values in the Area
Average Home Value in this Area
Purchase History
| Date | Buyer | Sale Price | Title Company |
|---|---|---|---|
| Martos 72 Llc | $1,800,000 | -- | |
| Martos 72 Llc | $1,800,000 | -- | |
| Martos 72 Llc | $1,800,000 | -- | |
| Taormina Associates Ltd | -- | -- | |
| Taormina Associates Ltd | -- | -- | |
| Estate Of May Taormina | -- | -- | |
| Taormina Geraldine | -- | -- | |
| Taormina Geraldine | -- | -- | |
| Taormina Geraldine | -- | -- | |
| Estate Of May Taormina | -- | -- | |
| Taormina Geraldine | -- | -- |
Source: Public Records
Tax History
| Year | Tax Paid | Tax Assessment Tax Assessment Total Assessment is a certain percentage of the fair market value that is determined by local assessors to be the total taxable value of land and additions on the property. | Land | Improvement |
|---|---|---|---|---|
| 2025 | $35,786 | $340,380 | $191,250 | $149,130 |
| 2024 | $35,786 | $337,860 | $191,250 | $146,610 |
| 2023 | $35,260 | $331,200 | $191,250 | $139,950 |
| 2022 | $17,428 | $335,700 | $191,250 | $144,450 |
| 2021 | $31,954 | $298,800 | $191,250 | $107,550 |
| 2020 | $33,999 | $379,350 | $191,250 | $188,100 |
| 2019 | $32,827 | $328,500 | $191,250 | $137,250 |
| 2018 | $31,388 | $298,540 | $109,170 | $189,370 |
| 2017 | $31,265 | $297,370 | $85,140 | $212,230 |
| 2016 | $29,197 | $297,370 | $85,140 | $212,230 |
| 2015 | $12,677 | $246,870 | $78,120 | $168,750 |
| 2014 | $12,677 | $209,430 | $74,610 | $134,820 |
Source: Public Records
Map
Nearby Homes
- 52-79 72nd St
- 70-03 52nd Ave
- 71-22 Calamus Ave
- 71-10 52nd Ave
- 7338 52nd Rd
- 51-29 69th Place
- 52-14 69th St
- 73-37 52nd Ave
- 7219 Grand Ave
- 7291 Calamus Ave
- 72-17 Grand Ave
- 52-62 68th St
- 5441 71st St
- 50-46 69th Place
- 74-47 Calamus Ave Unit 48
- 74-49 Calamus Ave Unit 51
- 5244 79th St
- 70-07 Grand Ave
- 53-36 67th St
- 52-49 79th St
Your Personal Tour Guide
Ask me questions while you tour the home.