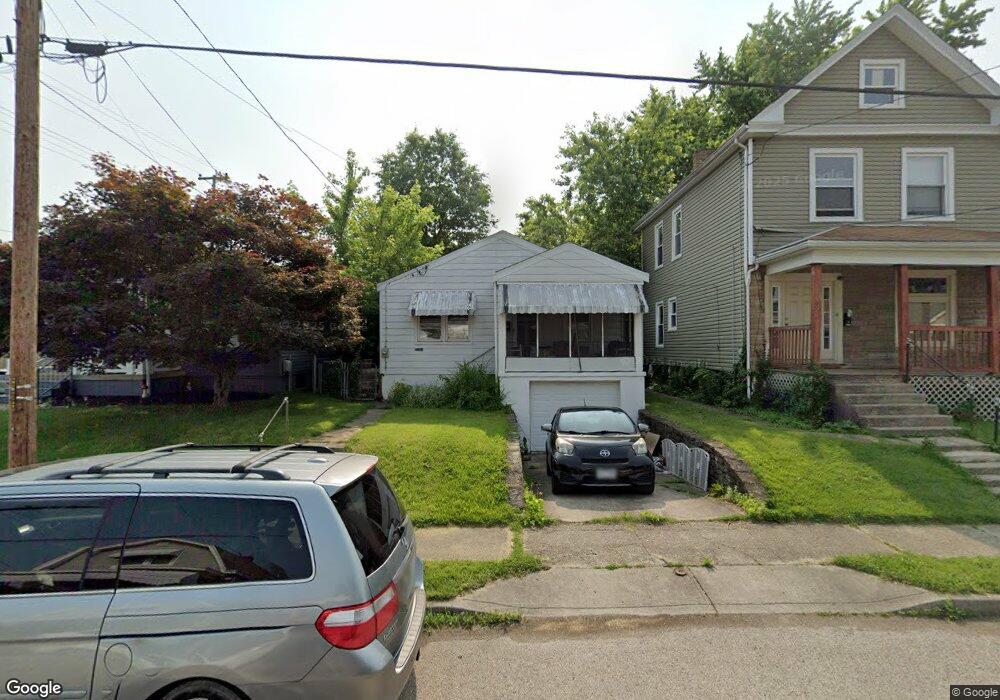
5254 Warren Ave Cincinnati, OH 45212
Estimated Value: $142,000 - $170,000
2
Beds
1
Bath
750
Sq Ft
$207/Sq Ft
Est. Value
About This Home
This home is located at 5254 Warren Ave, Cincinnati, OH 45212 and is currently estimated at $155,535, approximately $207 per square foot. 5254 Warren Ave is a home located in Hamilton County with nearby schools including Norwood High School, Summit Academy Community School - Cincinnati, and Cornerstone Christian Academy.
Ownership History
Date
Name
Owned For
Owner Type
Purchase Details
Closed on
May 7, 2008
Sold by
Graf Eileen
Bought by
Graf Nancy Ann
Current Estimated Value
Purchase Details
Closed on
May 1, 2008
Sold by
Estate Of Joseph W Graf
Bought by
Graf Eileen
Purchase Details
Closed on
Oct 27, 2006
Sold by
Keybank Na
Bought by
Graf Joseph W
Home Financials for this Owner
Home Financials are based on the most recent Mortgage that was taken out on this home.
Original Mortgage
$34,200
Interest Rate
6.36%
Mortgage Type
Unknown
Purchase Details
Closed on
Jul 21, 2006
Sold by
Wolf Donald G
Bought by
Keybank Na
Purchase Details
Closed on
Aug 1, 1995
Sold by
Trickler Loretta and Follett Lenora G
Bought by
Wolf Donald G
Home Financials for this Owner
Home Financials are based on the most recent Mortgage that was taken out on this home.
Original Mortgage
$61,800
Interest Rate
7.51%
Purchase Details
Closed on
Oct 8, 1993
Sold by
Hoover Hazel Etta
Bought by
Trickler Loretta and Follett Lenora G
Create a Home Valuation Report for This Property
The Home Valuation Report is an in-depth analysis detailing your home's value as well as a comparison with similar homes in the area
Home Values in the Area
Average Home Value in this Area
Purchase History
| Date | Buyer | Sale Price | Title Company |
|---|---|---|---|
| Graf Nancy Ann | -- | Attorney | |
| Graf Eileen | -- | None Available | |
| Graf Joseph W | $38,000 | Attorney | |
| Keybank Na | $50,000 | None Available | |
| Wolf Donald G | -- | Midland Title Security Inc | |
| Trickler Loretta | -- | -- |
Source: Public Records
Mortgage History
| Date | Status | Borrower | Loan Amount |
|---|---|---|---|
| Previous Owner | Graf Joseph W | $34,200 | |
| Previous Owner | Wolf Donald G | $61,800 |
Source: Public Records
Tax History Compared to Growth
Tax History
| Year | Tax Paid | Tax Assessment Tax Assessment Total Assessment is a certain percentage of the fair market value that is determined by local assessors to be the total taxable value of land and additions on the property. | Land | Improvement |
|---|---|---|---|---|
| 2024 | $1,658 | $32,992 | $9,125 | $23,867 |
| 2023 | $1,703 | $32,992 | $9,125 | $23,867 |
| 2022 | $1,451 | $23,601 | $6,916 | $16,685 |
| 2021 | $1,409 | $23,601 | $6,916 | $16,685 |
| 2020 | $1,413 | $23,601 | $6,916 | $16,685 |
| 2019 | $1,342 | $20,703 | $6,066 | $14,637 |
| 2018 | $1,343 | $20,703 | $6,066 | $14,637 |
| 2017 | $1,267 | $20,703 | $6,066 | $14,637 |
| 2016 | $1,448 | $22,856 | $5,702 | $17,154 |
| 2015 | $1,290 | $22,856 | $5,702 | $17,154 |
| 2014 | $1,287 | $22,856 | $5,702 | $17,154 |
| 2013 | $1,355 | $24,315 | $6,066 | $18,249 |
Source: Public Records
Map
Nearby Homes
- 5252 Warren Ave
- 5258 Hunter Ave
- 5314 Section Ave
- 5328 Rolston Ave
- 5334 Warren Ave
- 5209 Warren Ave
- 5343 Hunter Ave
- 5209 Rhode Island Ave
- 1946 Berkley Ave
- 5201 Globe Ave
- 5309 Carthage Ave
- 1939 Lawn Ave
- 5116 Warren Ave
- 5107 Hunter Ave
- 5432 Rolston Ave
- 5121 Silver St
- 5508 Warren Ave
- 2102 Ross Ave
- 2115 Quatman Ave
- 1832 Catalina Ave
- 5256 Warren Ave
- 5250 Warren Ave
- 5248 Warren Ave
- 5255 Rolston Ave
- 5253 Rolston Ave
- 5257 Rolston Ave
- 5257 Rolston Ave Unit 2
- 5244 Warren Ave
- 5300 Warren Ave
- 5249 Rolston Ave
- 5245 Rolston Ave
- 5302 Warren Ave
- 5255 Warren Ave
- 5301 Rolston Ave
- 5257 Warren Ave
- 5253 Warren Ave
- 5242 Warren Ave
- 5251 Warren Ave
- 5243 Rolston Ave
- 5249 Warren Ave