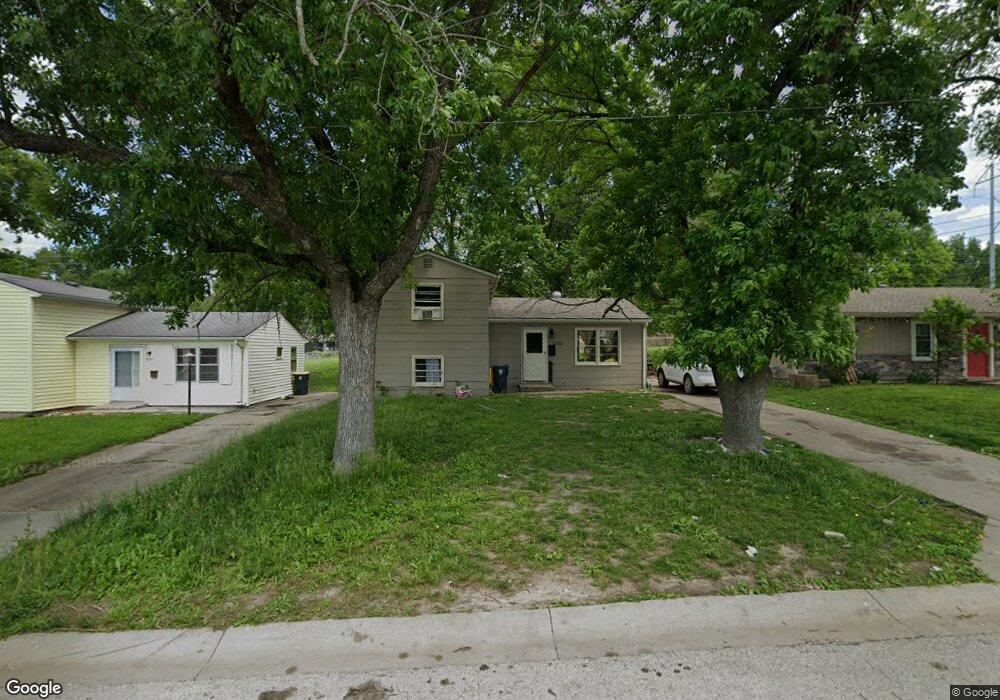
5259 Sycamore Ave Kansas City, MO 64129
Eastwood Hills East NeighborhoodEstimated Value: $137,539 - $149,000
3
Beds
1
Bath
764
Sq Ft
$190/Sq Ft
Est. Value
About This Home
This home is located at 5259 Sycamore Ave, Kansas City, MO 64129 and is currently estimated at $144,885, approximately $189 per square foot. 5259 Sycamore Ave is a home located in Jackson County with nearby schools including Eastwood Hills Elementary, Raytown Middle School, and Raytown South High School.
Ownership History
Date
Name
Owned For
Owner Type
Purchase Details
Closed on
Feb 24, 2023
Sold by
Schulz Scott P
Bought by
Franco Sandra
Current Estimated Value
Purchase Details
Closed on
Jul 25, 2012
Sold by
Chandler Monica L
Bought by
Jab Llc
Purchase Details
Closed on
Jun 1, 2012
Sold by
Schlak Lawrence W
Bought by
Chandler Monica L
Purchase Details
Closed on
Jul 16, 2009
Sold by
U S Bank National Association
Bought by
Chandler Monica L
Purchase Details
Closed on
Jan 14, 2009
Sold by
Harbour Tasha
Bought by
Lasalle Bank National Association
Purchase Details
Closed on
Feb 18, 2006
Sold by
Lackey Harvey A and Lackey Melba
Bought by
Harbour Tasha
Home Financials for this Owner
Home Financials are based on the most recent Mortgage that was taken out on this home.
Original Mortgage
$71,300
Interest Rate
6.05%
Mortgage Type
Fannie Mae Freddie Mac
Purchase Details
Closed on
Jul 6, 2001
Sold by
Lackey Beverly M
Bought by
Lackey Harvey A
Create a Home Valuation Report for This Property
The Home Valuation Report is an in-depth analysis detailing your home's value as well as a comparison with similar homes in the area
Home Values in the Area
Average Home Value in this Area
Purchase History
| Date | Buyer | Sale Price | Title Company |
|---|---|---|---|
| Franco Sandra | -- | None Listed On Document | |
| Jab Llc | -- | Continental Title | |
| Chandler Monica L | -- | None Available | |
| Chandler Monica L | -- | First American Title | |
| Lasalle Bank National Association | $76,000 | None Available | |
| Harbour Tasha | -- | Great Plains Title Co Llc | |
| Lackey Harvey A | -- | Ati Title Company |
Source: Public Records
Mortgage History
| Date | Status | Borrower | Loan Amount |
|---|---|---|---|
| Previous Owner | Harbour Tasha | $71,300 |
Source: Public Records
Tax History Compared to Growth
Tax History
| Year | Tax Paid | Tax Assessment Tax Assessment Total Assessment is a certain percentage of the fair market value that is determined by local assessors to be the total taxable value of land and additions on the property. | Land | Improvement |
|---|---|---|---|---|
| 2025 | $1,559 | $6,031 | $2,267 | $3,764 |
| 2024 | $1,549 | $17,222 | $1,987 | $15,235 |
| 2023 | $1,549 | $17,222 | $1,739 | $15,483 |
| 2022 | $427 | $4,560 | $990 | $3,570 |
| 2021 | $427 | $4,560 | $990 | $3,570 |
| 2020 | $438 | $4,630 | $990 | $3,640 |
| 2019 | $430 | $4,630 | $990 | $3,640 |
| 2018 | $428 | $4,630 | $990 | $3,640 |
| 2017 | $395 | $4,630 | $990 | $3,640 |
| 2016 | $395 | $4,305 | $1,957 | $2,348 |
| 2014 | $385 | $4,180 | $1,900 | $2,280 |
Source: Public Records
Map
Nearby Homes
- 5132 Skiles Ave
- 4701 Skiles Ave
- 5140 Booth Ave
- 7525 E 52nd St
- 5002 Skiles Ave
- 7803 E 50th Terrace
- 4958 Marsh Ave
- 5117 Booth Ave
- 5500 Wallace Ave
- 5119 Booth Ave
- 4949 Laramie Ln
- 7509 E 50th St
- 8705 E 53rd Terrace
- 5609 Oakland Ave
- 5611 Oakland Ave
- 7605 Sni A Bar Terrace
- 7410 E 57th St
- 7405 E 49th St
- 7406 E 57th St
- 7102 E 55th St
- 5263 Sycamore Ave
- 5255 Sycamore Ave
- 5251 Sycamore Ave
- 5247 Sycamore Ave
- 5243 Sycamore Ave
- 5400 Sycamore Ave
- 5403 Sycamore Ave
- 5239 Sycamore Ave
- 5254 Skiles Ave
- 5250 Skiles Ave
- 5258 Skiles Ave
- 5246 Skiles Ave
- 5402 Sycamore Ave
- 5233 Sycamore Ave
- 5242 Skiles Ave
- 5405 Sycamore Ave
- 5400 Skiles Ave
- 5238 Skiles Ave
- 5229 Sycamore Ave
- 5402 Skiles Ave