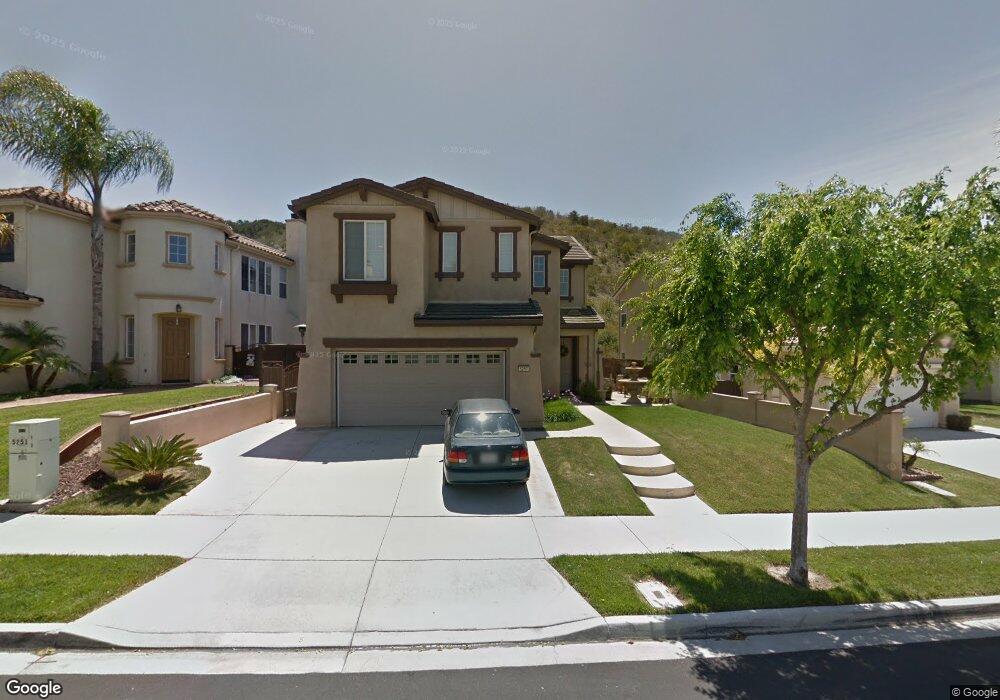
5259 Westport View Dr Unit 2 San Diego, CA 92154
Ocean View Hills NeighborhoodEstimated Value: $941,000 - $1,040,000
5
Beds
3
Baths
2,300
Sq Ft
$426/Sq Ft
Est. Value
About This Home
This home is located at 5259 Westport View Dr Unit 2, San Diego, CA 92154 and is currently estimated at $979,750, approximately $425 per square foot. 5259 Westport View Dr Unit 2 is a home located in San Diego County with nearby schools including Ocean View Hills, Vista Del Mar, and San Ysidro Middle School.
Ownership History
Date
Name
Owned For
Owner Type
Purchase Details
Closed on
Mar 26, 2021
Sold by
Sarsoza Lloyd M and Sarsoza Michelle M
Bought by
Sarsoza Lloyd M and Sarsoza Michelle M
Current Estimated Value
Purchase Details
Closed on
Mar 2, 2016
Sold by
Sarsoza Lloyd M and Sarsoza Michelle Marie Marasigan
Bought by
Sarsoza Lloyd M and Sarsoza Michelle Marie Marasigan
Home Financials for this Owner
Home Financials are based on the most recent Mortgage that was taken out on this home.
Original Mortgage
$465,300
Outstanding Balance
$369,987
Interest Rate
3.79%
Mortgage Type
New Conventional
Estimated Equity
$609,763
Purchase Details
Closed on
Aug 6, 2004
Sold by
Western Pacific Housing Inc
Bought by
Sarsoza Lloyd M and Marasigan Michelle Marie Q
Home Financials for this Owner
Home Financials are based on the most recent Mortgage that was taken out on this home.
Original Mortgage
$496,200
Interest Rate
3.87%
Mortgage Type
Purchase Money Mortgage
Create a Home Valuation Report for This Property
The Home Valuation Report is an in-depth analysis detailing your home's value as well as a comparison with similar homes in the area
Home Values in the Area
Average Home Value in this Area
Purchase History
| Date | Buyer | Sale Price | Title Company |
|---|---|---|---|
| Sarsoza Lloyd M | -- | None Available | |
| Sarsoza Lloyd M | -- | Fidelity Natl Title Co Sd | |
| Sarsoza Lloyd M | $620,500 | First American Title |
Source: Public Records
Mortgage History
| Date | Status | Borrower | Loan Amount |
|---|---|---|---|
| Open | Sarsoza Lloyd M | $465,300 | |
| Previous Owner | Sarsoza Lloyd M | $496,200 | |
| Closed | Sarsoza Lloyd M | $93,000 |
Source: Public Records
Tax History Compared to Growth
Tax History
| Year | Tax Paid | Tax Assessment Tax Assessment Total Assessment is a certain percentage of the fair market value that is determined by local assessors to be the total taxable value of land and additions on the property. | Land | Improvement |
|---|---|---|---|---|
| 2025 | $12,593 | $873,323 | $236,958 | $636,365 |
| 2024 | $12,593 | $856,200 | $232,312 | $623,888 |
| 2023 | $12,339 | $839,412 | $227,757 | $611,655 |
| 2022 | $10,967 | $750,000 | $191,000 | $559,000 |
| 2021 | $10,249 | $675,000 | $172,000 | $503,000 |
| 2020 | $9,373 | $610,000 | $156,000 | $454,000 |
| 2019 | $10,314 | $585,000 | $150,000 | $435,000 |
| 2018 | $10,053 | $565,000 | $145,000 | $420,000 |
| 2017 | $81 | $510,000 | $131,000 | $379,000 |
| 2016 | $8,957 | $485,000 | $125,000 | $360,000 |
| 2015 | $8,512 | $445,000 | $117,000 | $328,000 |
| 2014 | $6,762 | $420,000 | $111,000 | $309,000 |
Source: Public Records
Map
Nearby Homes
- 5317 Westport View Dr
- 5192 Emerald Cove
- 1210 Jade Cove Ct
- 1250 Sand Drift Point
- 5080 Sea Reef Place
- 1233 Sandy Cape Ct
- 782 Anchor Cove
- 1270 Paseo Sea Breeze Unit 26
- 5465 Seacliff Place Unit 76
- 5211 Calle Rockfish Unit 90
- 1251 Paseo Sea Breeze Unit 14
- 1251 Paseo Sea Breeze Unit 17
- 1320 Calle Sandcliff Unit 41
- 5140 Calle Sand Arch Unit 61
- 5405 Calle Sand Arch Unit 197
- 5360 Calle Rockfish Unit 32
- 5402 Sand Arch Ln Unit 199
- 477 Vista San Lucas
- 5208 Surfwalk Way Unit 153
- 5265 Beachfront Cove Unit 167
- 5253 Westport View Dr
- 5265 Westport View Dr
- 5271 Westport View Dr Unit 2
- 5247 Westport View Dr
- 1131 Parsons Landing Unit 2
- 1132 Sunset Crossing Point
- 5277 Westport View Dr
- 5241 Westport View Dr
- 1127 Parsons Landing
- 5283 Westport View Dr Unit 2
- 5235 Westport View Dr
- 1128 Sunset Crossing Point
- 5248 Westport View Dr
- 1113 Parsons Landing Unit 2
- 5289 Westport View Dr
- 5276 Westport View Dr
- 5229 Westport View Dr
- 1120 Sunset Crossing Point
- 5242 Westport View Dr
- 5282 Westport View Dr