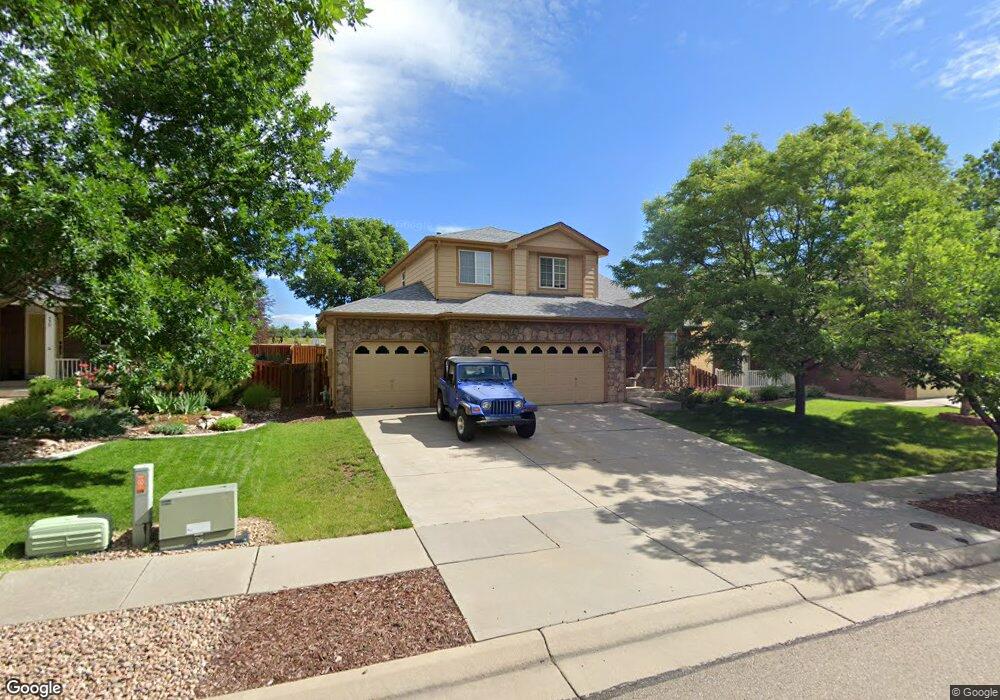
526 Arbor Dr Lafayette, CO 80026
Estimated Value: $774,081 - $868,000
4
Beds
3
Baths
2,037
Sq Ft
$398/Sq Ft
Est. Value
About This Home
This home is located at 526 Arbor Dr, Lafayette, CO 80026 and is currently estimated at $810,770, approximately $398 per square foot. 526 Arbor Dr is a home located in Boulder County with nearby schools including Alicia Sanchez International Elementary School, Angevine Middle School, and Centaurus High School.
Ownership History
Date
Name
Owned For
Owner Type
Purchase Details
Closed on
Jul 14, 2008
Sold by
Lehnert Votan M
Bought by
Hankla Allen K
Current Estimated Value
Home Financials for this Owner
Home Financials are based on the most recent Mortgage that was taken out on this home.
Original Mortgage
$229,000
Outstanding Balance
$145,322
Interest Rate
6.09%
Mortgage Type
Purchase Money Mortgage
Estimated Equity
$665,448
Purchase Details
Closed on
Mar 15, 2004
Sold by
Lehnert Votan M and Lehnert Osnald H
Bought by
Lehnert Votan M
Purchase Details
Closed on
Aug 22, 2002
Sold by
Lehnert Franz and Lehnert Votan M
Bought by
Lehnert Votan M
Purchase Details
Closed on
Dec 21, 1998
Sold by
Woodcrest Homes Inc
Bought by
Lehnert Franz M
Home Financials for this Owner
Home Financials are based on the most recent Mortgage that was taken out on this home.
Original Mortgage
$181,520
Interest Rate
6.92%
Create a Home Valuation Report for This Property
The Home Valuation Report is an in-depth analysis detailing your home's value as well as a comparison with similar homes in the area
Home Values in the Area
Average Home Value in this Area
Purchase History
| Date | Buyer | Sale Price | Title Company |
|---|---|---|---|
| Hankla Allen K | $328,000 | Security Title | |
| Lehnert Votan M | -- | -- | |
| Lehnert Votan M | -- | -- | |
| Lehnert Franz M | $201,705 | Land Title |
Source: Public Records
Mortgage History
| Date | Status | Borrower | Loan Amount |
|---|---|---|---|
| Open | Hankla Allen K | $229,000 | |
| Previous Owner | Lehnert Franz M | $181,520 |
Source: Public Records
Tax History
| Year | Tax Paid | Tax Assessment Tax Assessment Total Assessment is a certain percentage of the fair market value that is determined by local assessors to be the total taxable value of land and additions on the property. | Land | Improvement |
|---|---|---|---|---|
| 2025 | $4,554 | $49,738 | $11,750 | $37,988 |
| 2024 | $4,554 | $49,738 | $11,750 | $37,988 |
| 2023 | $4,476 | $51,389 | $13,273 | $41,801 |
| 2022 | $3,738 | $39,796 | $10,036 | $29,760 |
| 2021 | $3,697 | $40,941 | $10,325 | $30,616 |
| 2020 | $3,486 | $38,138 | $9,867 | $28,271 |
| 2019 | $3,437 | $38,138 | $9,867 | $28,271 |
| 2018 | $3,011 | $32,983 | $7,848 | $25,135 |
| 2017 | $2,932 | $36,464 | $8,676 | $27,788 |
| 2016 | $2,777 | $30,248 | $6,846 | $23,402 |
| 2015 | $2,602 | $24,676 | $8,995 | $15,681 |
| 2014 | $2,134 | $24,676 | $8,995 | $15,681 |
Source: Public Records
Map
Nearby Homes
- 444 Levi Ln
- 448 Levi Ln
- 452 Levi Ln
- 0 Rainbow Ln
- 613 Westcliff Dr
- 605 W Baseline Rd
- 710 Sedge Way
- 402 W Baseline Rd Unit H
- 400 W Baseline Rd Unit B
- 770 W Cleveland Cir
- 394 W Lucerne Dr
- 1140 Devonshire Ct
- 696 Homestead St
- 1215 Devonshire Ct
- 561 Homestead St Unit 561
- 421 S Dover Ave
- 805 Furrow Way
- 200 W Simpson St
- 403 W Cannon St
- 107 N Public Rd
Your Personal Tour Guide
Ask me questions while you tour the home.