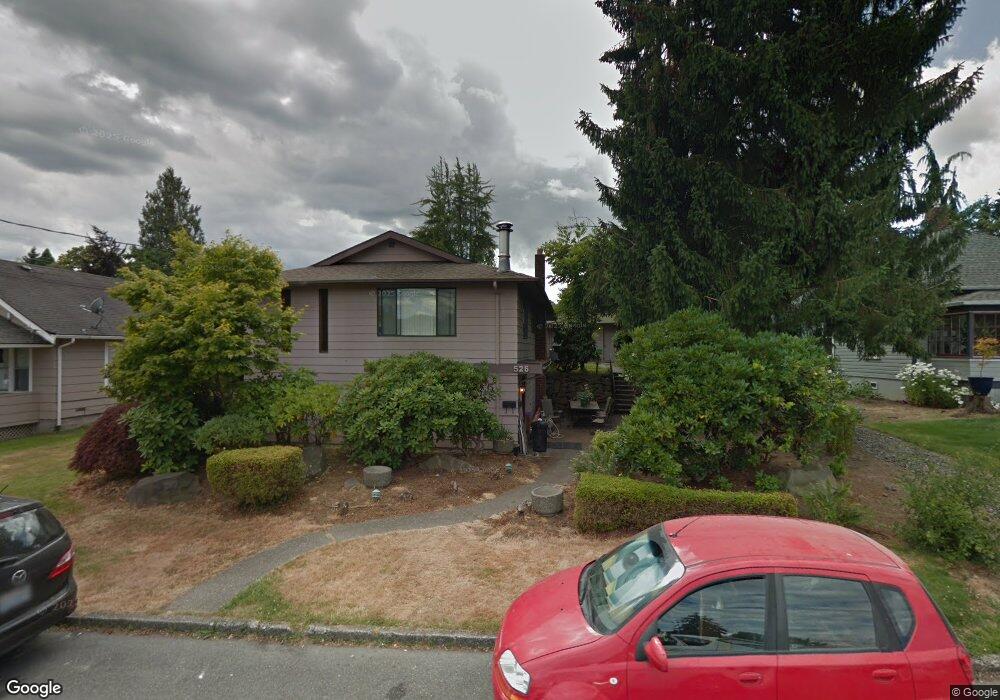
526 Avenue A Unit 1 Snohomish, WA 98290
Estimated Value: $738,000 - $1,189,000
1
Bed
1
Bath
1,512
Sq Ft
$590/Sq Ft
Est. Value
About This Home
This home is located at 526 Avenue A Unit 1, Snohomish, WA 98290 and is currently estimated at $891,981, approximately $589 per square foot. 526 Avenue A Unit 1 is a home located in Snohomish County with nearby schools including Central Emerson Elementary School, Centennial Middle School, and Snohomish High School.
Ownership History
Date
Name
Owned For
Owner Type
Purchase Details
Closed on
Jul 17, 2003
Sold by
Tschernich Rudy Warren
Bought by
Sterley Kathryn E
Current Estimated Value
Home Financials for this Owner
Home Financials are based on the most recent Mortgage that was taken out on this home.
Original Mortgage
$228,000
Outstanding Balance
$96,130
Interest Rate
5.15%
Mortgage Type
Purchase Money Mortgage
Estimated Equity
$795,851
Purchase Details
Closed on
Dec 31, 1997
Sold by
Tschernich Rudolf W
Bought by
Tschernich Rudy Warren
Create a Home Valuation Report for This Property
The Home Valuation Report is an in-depth analysis detailing your home's value as well as a comparison with similar homes in the area
Home Values in the Area
Average Home Value in this Area
Purchase History
| Date | Buyer | Sale Price | Title Company |
|---|---|---|---|
| Sterley Kathryn E | $228,000 | First American | |
| Tschernich Rudy Warren | -- | -- |
Source: Public Records
Mortgage History
| Date | Status | Borrower | Loan Amount |
|---|---|---|---|
| Open | Sterley Kathryn E | $228,000 |
Source: Public Records
Tax History Compared to Growth
Tax History
| Year | Tax Paid | Tax Assessment Tax Assessment Total Assessment is a certain percentage of the fair market value that is determined by local assessors to be the total taxable value of land and additions on the property. | Land | Improvement |
|---|---|---|---|---|
| 2025 | $5,856 | $649,200 | $392,000 | $257,200 |
| 2024 | $5,856 | $601,900 | $352,800 | $249,100 |
| 2023 | $5,673 | $646,500 | $382,200 | $264,300 |
| 2022 | $5,319 | $492,600 | $265,600 | $227,000 |
| 2020 | $4,235 | $364,500 | $209,500 | $155,000 |
| 2019 | $4,247 | $373,100 | $194,000 | $179,100 |
| 2018 | $4,572 | $336,300 | $174,600 | $161,700 |
| 2017 | $4,149 | $311,100 | $150,400 | $160,700 |
| 2016 | $3,879 | $281,900 | $124,200 | $157,700 |
| 2015 | $3,909 | $272,000 | $104,500 | $167,500 |
| 2013 | $3,363 | $227,200 | $66,500 | $160,700 |
Source: Public Records
Map
Nearby Homes