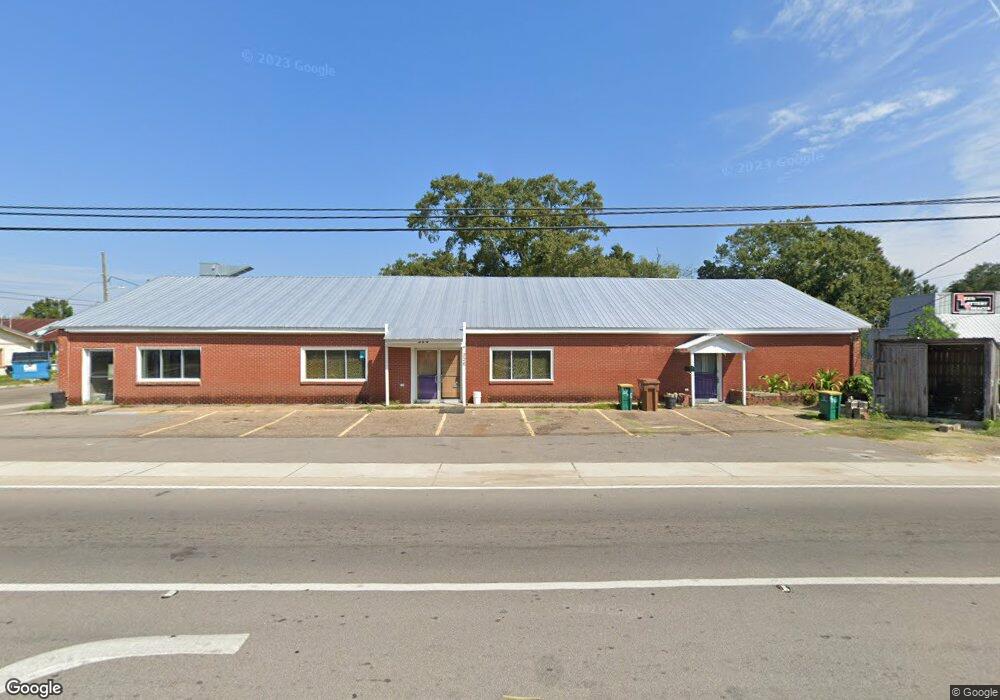
526 Division St Biloxi, MS 39530
Estimated Value: $214,000 - $343,000
Studio
1
Bath
4,145
Sq Ft
$67/Sq Ft
Est. Value
About This Home
This home is located at 526 Division St, Biloxi, MS 39530 and is currently estimated at $279,337, approximately $67 per square foot. 526 Division St is a home located in Harrison County with nearby schools including Gorenflo Elementary School, Biloxi Junior High School, and Biloxi High School.
Ownership History
Date
Name
Owned For
Owner Type
Purchase Details
Closed on
Dec 18, 2024
Sold by
Le Viet A
Bought by
Vannguyen Hai Van and Vannguyen Binh Van
Current Estimated Value
Home Financials for this Owner
Home Financials are based on the most recent Mortgage that was taken out on this home.
Original Mortgage
$134,041
Outstanding Balance
$114,700
Interest Rate
6.72%
Mortgage Type
Credit Line Revolving
Estimated Equity
$164,637
Purchase Details
Closed on
Dec 5, 2024
Sold by
Tran Kimphuong T
Bought by
Vannguyen Hai Van and Vannguyen Binh Van
Home Financials for this Owner
Home Financials are based on the most recent Mortgage that was taken out on this home.
Original Mortgage
$134,041
Outstanding Balance
$114,700
Interest Rate
6.72%
Mortgage Type
Credit Line Revolving
Estimated Equity
$164,637
Purchase Details
Closed on
Nov 25, 2014
Bought by
Co Viet
Create a Home Valuation Report for This Property
The Home Valuation Report is an in-depth analysis detailing your home's value as well as a comparison with similar homes in the area
Home Values in the Area
Average Home Value in this Area
Purchase History
| Date | Buyer | Sale Price | Title Company |
|---|---|---|---|
| Vannguyen Hai Van | -- | None Listed On Document | |
| Vannguyen Hai Van | -- | None Listed On Document | |
| Vannguyen Hai Van | -- | None Listed On Document | |
| Vannguyen Hai Van | -- | None Listed On Document | |
| Co Viet | -- | -- |
Source: Public Records
Mortgage History
| Date | Status | Borrower | Loan Amount |
|---|---|---|---|
| Open | Vannguyen Hai Van | $134,041 | |
| Closed | Vannguyen Hai Van | $134,041 |
Source: Public Records
Tax History
| Year | Tax Paid | Tax Assessment Tax Assessment Total Assessment is a certain percentage of the fair market value that is determined by local assessors to be the total taxable value of land and additions on the property. | Land | Improvement |
|---|---|---|---|---|
| 2025 | $2,995 | $26,799 | $0 | $0 |
| 2024 | $2,893 | $26,113 | $0 | $0 |
| 2023 | $924 | $17,085 | $0 | $0 |
| 2022 | $924 | $17,085 | $0 | $0 |
| 2021 | $924 | $17,085 | $0 | $0 |
| 2020 | $925 | $15,922 | $0 | $0 |
| 2019 | $1,750 | $15,922 | $0 | $0 |
| 2018 | $2,305 | $20,972 | $0 | $0 |
| 2017 | $2,305 | $20,972 | $0 | $0 |
| 2015 | $3,227 | $29,367 | $0 | $0 |
| 2014 | -- | $7,500 | $0 | $0 |
| 2013 | -- | $20,630 | $3,115 | $17,515 |
Source: Public Records
Map
Nearby Homes
- 306 Keller Ave
- 308 Keller Ave
- 296 Keller Ave
- 310 Keller Ave
- 303 Bowen St
- 519 Division St
- 538 Division St Unit B
- 312 Keller Ave
- 311 Bowen St
- 517 Division St
- 295 Keller Ave
- 288 Keller Ave
- 307 Keller Ave
- 510 Division St
- 316 Keller Ave
- 291 Keller Ave
- 511 Garic St
- 287 Bowen St
- 315 Bowen St
- 284 Keller Ave
Your Personal Tour Guide
Ask me questions while you tour the home.