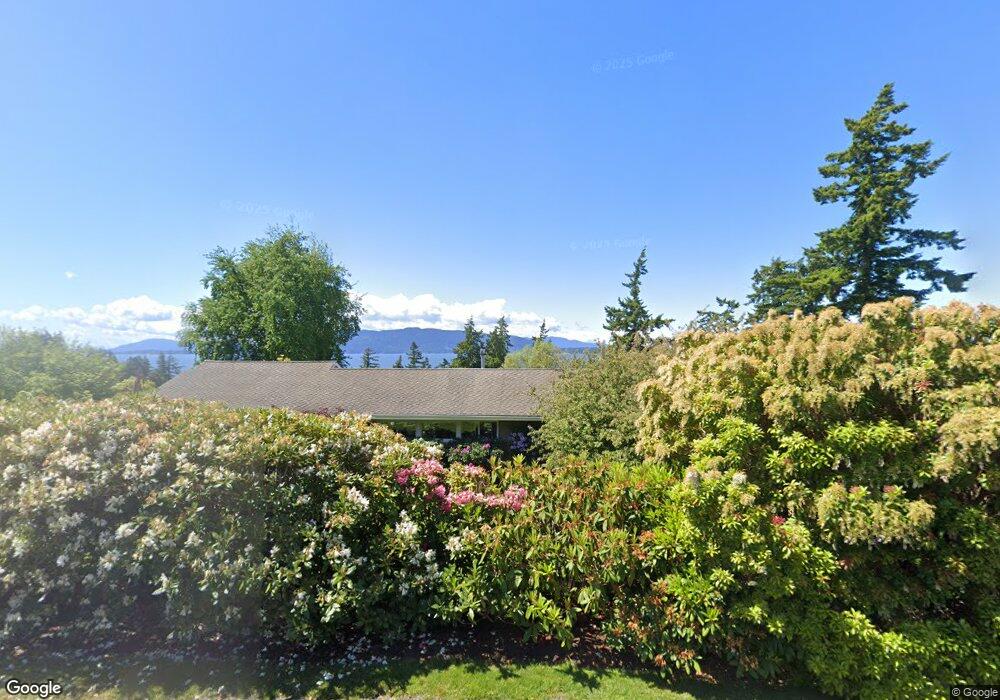
526 Fieldston Rd Bellingham, WA 98225
Edgemoor NeighborhoodEstimated Value: $1,252,000 - $1,404,000
2
Beds
2
Baths
1,478
Sq Ft
$896/Sq Ft
Est. Value
About This Home
This home is located at 526 Fieldston Rd, Bellingham, WA 98225 and is currently estimated at $1,324,072, approximately $895 per square foot. 526 Fieldston Rd is a home located in Whatcom County with nearby schools including Lowell Elementary School, Fairhaven Middle School, and Sehome High School.
Ownership History
Date
Name
Owned For
Owner Type
Purchase Details
Closed on
Sep 1, 2003
Sold by
Johnson John R and Johnson Lylene
Bought by
Johnson John R and Johnson Lylene
Current Estimated Value
Home Financials for this Owner
Home Financials are based on the most recent Mortgage that was taken out on this home.
Original Mortgage
$299,920
Outstanding Balance
$111,607
Interest Rate
3.5%
Mortgage Type
Purchase Money Mortgage
Estimated Equity
$1,212,465
Purchase Details
Closed on
Aug 14, 2003
Sold by
Beacom Richard J and Beacom Arlene C
Bought by
Johnson John R and Johnson Lylene
Home Financials for this Owner
Home Financials are based on the most recent Mortgage that was taken out on this home.
Original Mortgage
$299,920
Outstanding Balance
$111,607
Interest Rate
3.5%
Mortgage Type
Purchase Money Mortgage
Estimated Equity
$1,212,465
Create a Home Valuation Report for This Property
The Home Valuation Report is an in-depth analysis detailing your home's value as well as a comparison with similar homes in the area
Home Values in the Area
Average Home Value in this Area
Purchase History
| Date | Buyer | Sale Price | Title Company |
|---|---|---|---|
| Johnson John R | -- | -- | |
| Johnson John R | $374,900 | Whatcom Land Title |
Source: Public Records
Mortgage History
| Date | Status | Borrower | Loan Amount |
|---|---|---|---|
| Open | Johnson John R | $299,920 |
Source: Public Records
Tax History Compared to Growth
Tax History
| Year | Tax Paid | Tax Assessment Tax Assessment Total Assessment is a certain percentage of the fair market value that is determined by local assessors to be the total taxable value of land and additions on the property. | Land | Improvement |
|---|---|---|---|---|
| 2024 | $9,318 | $1,156,475 | $802,465 | $354,010 |
| 2023 | $9,318 | $1,197,822 | $831,155 | $366,667 |
| 2022 | $7,674 | $1,019,429 | $707,370 | $312,059 |
| 2021 | $7,291 | $822,142 | $570,475 | $251,667 |
| 2020 | $7,164 | $721,172 | $500,413 | $220,759 |
| 2019 | $6,774 | $684,548 | $475,000 | $209,548 |
| 2018 | $7,004 | $649,051 | $423,150 | $225,901 |
| 2017 | $6,177 | $576,121 | $375,600 | $200,521 |
| 2016 | $5,622 | $530,356 | $345,600 | $184,756 |
| 2015 | $5,534 | $502,898 | $327,600 | $175,298 |
| 2014 | -- | $478,943 | $312,000 | $166,943 |
| 2013 | -- | $457,642 | $300,000 | $157,642 |
Source: Public Records
Map
Nearby Homes
- 505 Willow Rd
- 624 Clark Rd
- 404 Willow Road Place
- 406 Willow Road Place
- 507 Lyla Ln
- 405 Bayside Rd
- 1301 Broad St
- 214 Bayside Rd
- 2600 16th St
- 331 Chuckanut Dr N
- 425 Chuckanut Dr N Unit 5
- 30 Shorewood Dr
- 707 Donovan Ave
- 1212 Old Fairhaven Pkwy Unit D202
- 1302 Larrabee Ave
- 671 Chuckanut Dr N
- 910 Harris Ave Unit 208
- 910 Harris Ave Unit 304
- 1605 Donovan Ave
- 697 Chuckanut Dr N