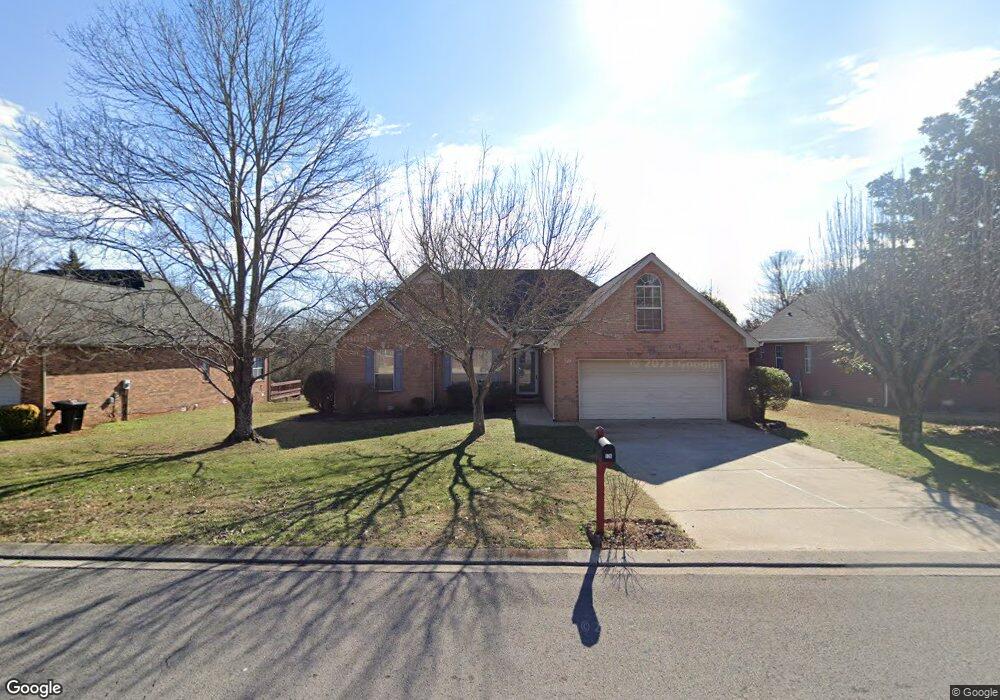
526 Forrest Pointe Dr Murfreesboro, TN 37130
Estimated Value: $351,977 - $406,000
--
Bed
3
Baths
1,665
Sq Ft
$232/Sq Ft
Est. Value
About This Home
This home is located at 526 Forrest Pointe Dr, Murfreesboro, TN 37130 and is currently estimated at $385,994, approximately $231 per square foot. 526 Forrest Pointe Dr is a home located in Rutherford County with nearby schools including Black Fox Elementary School, Christiana Middle School, and Riverdale High School.
Ownership History
Date
Name
Owned For
Owner Type
Purchase Details
Closed on
Jun 26, 2024
Sold by
Narain Vijay and Narain Veena
Bought by
Vijay Narain And Veena Narain Revocable Livin
Current Estimated Value
Purchase Details
Closed on
Apr 24, 1998
Sold by
Paul Tuma Robert
Bought by
Narain and Veena
Home Financials for this Owner
Home Financials are based on the most recent Mortgage that was taken out on this home.
Original Mortgage
$118,800
Interest Rate
7.03%
Purchase Details
Closed on
May 1, 1996
Sold by
Tasso Jill M
Bought by
Tuma and Claire
Purchase Details
Closed on
Jan 13, 1995
Sold by
Landmark Homes Of Tenn
Bought by
Tasso Jill M
Purchase Details
Closed on
Sep 6, 1994
Sold by
Forrest Partnership
Bought by
Landmark Homes Of Tenn Inc
Create a Home Valuation Report for This Property
The Home Valuation Report is an in-depth analysis detailing your home's value as well as a comparison with similar homes in the area
Home Values in the Area
Average Home Value in this Area
Purchase History
| Date | Buyer | Sale Price | Title Company |
|---|---|---|---|
| Vijay Narain And Veena Narain Revocable Livin | -- | None Listed On Document | |
| Vijay Narain And Veena Narain Revocable Livin | -- | None Listed On Document | |
| Narain | $132,000 | -- | |
| Tuma | $126,000 | -- | |
| Tasso Jill M | -- | -- | |
| Landmark Homes Of Tenn Inc | -- | -- |
Source: Public Records
Mortgage History
| Date | Status | Borrower | Loan Amount |
|---|---|---|---|
| Previous Owner | Landmark Homes Of Tenn Inc | $118,800 |
Source: Public Records
Tax History Compared to Growth
Tax History
| Year | Tax Paid | Tax Assessment Tax Assessment Total Assessment is a certain percentage of the fair market value that is determined by local assessors to be the total taxable value of land and additions on the property. | Land | Improvement |
|---|---|---|---|---|
| 2025 | $2,254 | $79,675 | $13,750 | $65,925 |
| 2024 | $2,254 | $79,675 | $13,750 | $65,925 |
| 2023 | $1,495 | $79,675 | $13,750 | $65,925 |
| 2022 | $1,288 | $79,675 | $13,750 | $65,925 |
| 2021 | $1,183 | $53,325 | $10,625 | $42,700 |
| 2020 | $1,183 | $53,325 | $10,625 | $42,700 |
| 2019 | $1,183 | $53,325 | $10,625 | $42,700 |
| 2018 | $1,626 | $53,325 | $0 | $0 |
| 2017 | $1,501 | $38,625 | $0 | $0 |
| 2016 | $1,501 | $38,625 | $0 | $0 |
| 2015 | $1,501 | $38,625 | $0 | $0 |
| 2014 | $960 | $38,625 | $0 | $0 |
| 2013 | -- | $38,250 | $0 | $0 |
Source: Public Records
Map
Nearby Homes
- 610 Messick Ct
- 1341 Shearron Ct
- 710 Saratoga Dr
- 1280 Middle Tennessee Blvd Unit C2
- 1280 Middle Tennessee Blvd Unit D6
- 1118 Houston Dr
- 1103 Virginia Ave
- 1016 Silver Point Dr
- 923 SE Broad St Unit 4
- 411 Tremont Dr
- 1003 Tyler Ct
- 1315 Bradyville Pike Unit 2
- 1315 Bradyville Pike Unit 1
- 602 Johnson St
- 706 Mars St
- 1103 S Baird Ln
- 1330 Eagle St
- 1326 Atlas St
- 1518 Cameron Ct
- 1302 Dr Martin Luther King Blvd Unit 26
- 532 Forrest Pointe Dr
- 520 Forrest Pointe Dr
- 538 Forrest Pointe Dr
- 514 Forrest Pointe Dr
- 539 Forrest Pointe Dr
- 1509 Boone Ct
- 533 Forrest Pointe Dr
- 545 Forrest Pointe Dr
- 527 Forrest Pointe Dr
- 544 Forrest Pointe Dr
- 551 Forrest Pointe Dr
- 521 Forrest Pointe Dr
- 508 Forrest Pointe Dr
- 1508 Boone Ct
- 550 Forrest Pointe Dr
- 557 Forrest Pointe Dr
- 515 Forrest Pointe Dr
- 1521 Boone Ct
- 1514 Boone Ct
- 509 Forrest Pointe Dr