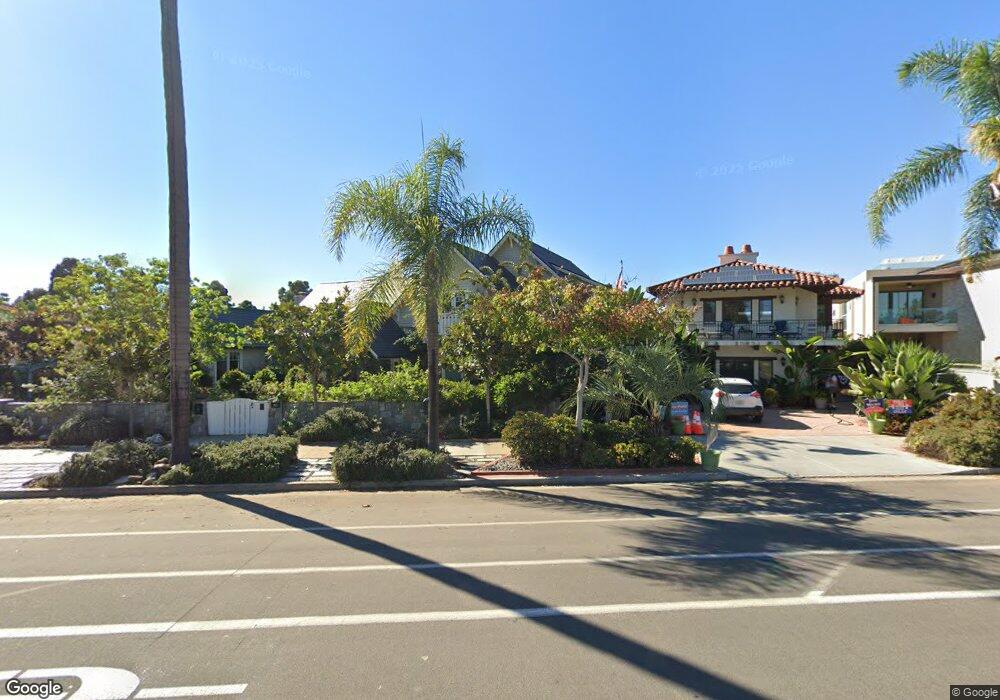
526 Glorietta Blvd Coronado, CA 92118
Estimated Value: $4,325,000 - $6,122,625
4
Beds
3
Baths
2,386
Sq Ft
$2,234/Sq Ft
Est. Value
About This Home
This home is located at 526 Glorietta Blvd, Coronado, CA 92118 and is currently estimated at $5,329,406, approximately $2,233 per square foot. 526 Glorietta Blvd is a home located in San Diego County with nearby schools including Coronado Village Elementary, Coronado Middle School, and Coronado High School.
Ownership History
Date
Name
Owned For
Owner Type
Purchase Details
Closed on
Dec 3, 2014
Sold by
Kearney Michael F and Kearney Carol L
Bought by
The Carol Kearney Revocable Living Trust
Current Estimated Value
Purchase Details
Closed on
Nov 9, 2012
Sold by
Moyer Michael
Bought by
Kearney Michael F and Kaearney Carol L
Purchase Details
Closed on
May 20, 1998
Sold by
Moyer Jeanne
Bought by
Moyer Jeanne and Moyer John
Purchase Details
Closed on
May 12, 1998
Sold by
Moyer Family Revocable Trusst 10-01-93
Bought by
Moyer John
Purchase Details
Closed on
May 6, 1998
Sold by
Moyer John S
Bought by
Moyer John and Moyer Jeanne
Purchase Details
Closed on
May 2, 1998
Sold by
Moyer Family Revocable Trusst 10-01-93
Bought by
Moyer Jeanne
Purchase Details
Closed on
Oct 1, 1993
Sold by
Moyer John S and Moyer Jeanne
Bought by
Moyer John S and Moyer Jeanne
Create a Home Valuation Report for This Property
The Home Valuation Report is an in-depth analysis detailing your home's value as well as a comparison with similar homes in the area
Home Values in the Area
Average Home Value in this Area
Purchase History
| Date | Buyer | Sale Price | Title Company |
|---|---|---|---|
| The Carol Kearney Revocable Living Trust | -- | None Available | |
| Kearney Michael F | $1,575,000 | None Available | |
| Moyer Jeanne | -- | -- | |
| Moyer John | -- | -- | |
| Moyer John | -- | -- | |
| Moyer Jeanne | -- | -- | |
| Moyer John S | -- | -- |
Source: Public Records
Tax History Compared to Growth
Tax History
| Year | Tax Paid | Tax Assessment Tax Assessment Total Assessment is a certain percentage of the fair market value that is determined by local assessors to be the total taxable value of land and additions on the property. | Land | Improvement |
|---|---|---|---|---|
| 2025 | $29,810 | $2,836,242 | $1,477,708 | $1,358,534 |
| 2024 | $29,810 | $2,780,631 | $1,448,734 | $1,331,897 |
| 2023 | $29,330 | $2,726,110 | $1,420,328 | $1,305,782 |
| 2022 | $28,769 | $2,672,658 | $1,392,479 | $1,280,179 |
| 2021 | $28,338 | $2,620,254 | $1,365,176 | $1,255,078 |
| 2020 | $7,011 | $2,593,387 | $1,351,178 | $1,242,209 |
| 2019 | $27,442 | $2,542,537 | $1,324,685 | $1,217,852 |
| 2018 | $26,968 | $2,492,684 | $1,298,711 | $1,193,973 |
| 2017 | $26,501 | $2,443,809 | $1,273,247 | $1,170,562 |
| 2016 | $25,697 | $2,395,892 | $1,248,282 | $1,147,610 |
| 2015 | $18,226 | $1,686,179 | $1,229,532 | $456,647 |
| 2014 | $17,047 | $1,582,150 | $1,205,448 | $376,702 |
Source: Public Records
Map
Nearby Homes
- 522 Glorietta Blvd
- 532 Glorietta Blvd
- 1533 Pendleton Rd
- 520 Glorietta Blvd
- 15215 Pendleton Rd
- 1530 Pendleton Rd
- 1625 6th St
- 1621 6th St
- 1525 Pendleton Rd
- 1633 6th St
- 508 Glorietta Blvd
- 1526 Pendleton Rd
- 540 Glorietta Blvd
- 1519 Pendleton Rd
- 1617 6th St
- 1524 Pendleton Rd
- 1515 Pendleton Rd
- 513 Pomona Ave
- 1611 6th St
- 544 Glorietta Blvd