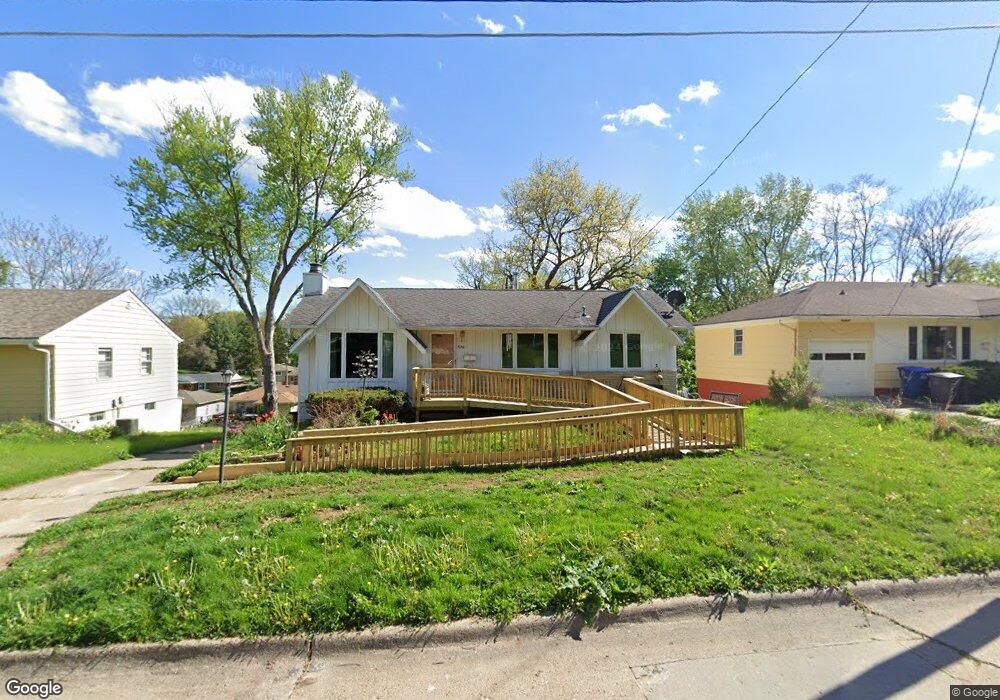
526 Miller Ave Des Moines, IA 50315
Watrous Heights NeighborhoodEstimated Value: $169,000 - $192,000
2
Beds
1
Bath
1,018
Sq Ft
$178/Sq Ft
Est. Value
About This Home
This home is located at 526 Miller Ave, Des Moines, IA 50315 and is currently estimated at $181,166, approximately $177 per square foot. 526 Miller Ave is a home located in Polk County with nearby schools including Park Avenue Elementary School, Brody Middle School, and Lincoln High School.
Ownership History
Date
Name
Owned For
Owner Type
Purchase Details
Closed on
Aug 18, 2022
Sold by
Darlene W Dickey Trust
Bought by
Burton Nancy
Current Estimated Value
Home Financials for this Owner
Home Financials are based on the most recent Mortgage that was taken out on this home.
Original Mortgage
$109,644
Outstanding Balance
$104,048
Interest Rate
4.63%
Mortgage Type
New Conventional
Estimated Equity
$77,119
Purchase Details
Closed on
Sep 25, 2018
Sold by
Dickey Kirk S
Bought by
Burton Nancy and Williams Timothy
Home Financials for this Owner
Home Financials are based on the most recent Mortgage that was taken out on this home.
Original Mortgage
$112,000
Interest Rate
4.5%
Purchase Details
Closed on
Mar 19, 2014
Sold by
Dickey Darlene W
Bought by
Dickey Kirk S
Create a Home Valuation Report for This Property
The Home Valuation Report is an in-depth analysis detailing your home's value as well as a comparison with similar homes in the area
Home Values in the Area
Average Home Value in this Area
Purchase History
| Date | Buyer | Sale Price | Title Company |
|---|---|---|---|
| Burton Nancy | $112,000 | None Listed On Document | |
| Burton Nancy | $112,000 | None Available | |
| Dickey Kirk S | -- | None Available |
Source: Public Records
Mortgage History
| Date | Status | Borrower | Loan Amount |
|---|---|---|---|
| Open | Burton Nancy | $109,644 | |
| Previous Owner | Burton Nancy | $112,000 |
Source: Public Records
Tax History Compared to Growth
Tax History
| Year | Tax Paid | Tax Assessment Tax Assessment Total Assessment is a certain percentage of the fair market value that is determined by local assessors to be the total taxable value of land and additions on the property. | Land | Improvement |
|---|---|---|---|---|
| 2025 | $2,992 | $189,400 | $37,000 | $152,400 |
| 2024 | $2,992 | $169,600 | $32,600 | $137,000 |
| 2023 | $3,004 | $169,600 | $32,600 | $137,000 |
| 2022 | $2,978 | $136,300 | $26,800 | $109,500 |
| 2021 | $2,834 | $136,300 | $26,800 | $109,500 |
| 2020 | $2,940 | $122,200 | $23,800 | $98,400 |
| 2019 | $3,514 | $122,200 | $23,800 | $98,400 |
| 2018 | $3,474 | $139,300 | $20,700 | $118,600 |
| 2017 | $3,208 | $139,300 | $20,700 | $118,600 |
| 2016 | $3,120 | $127,100 | $18,700 | $108,400 |
| 2015 | $3,120 | $127,100 | $18,700 | $108,400 |
| 2014 | $2,836 | $119,700 | $17,200 | $102,500 |
Source: Public Records
Map
Nearby Homes
- 410 Thornton Ave
- 3634 SW 4th St
- 3308 SW 7th St
- 3605 SW 9th St
- 300 Hughes Ave
- 3618 SW 9th St
- 3503 SW 2nd St
- 915 Wolcott Ave
- 3224 SW 2nd St
- 3903 SW 9th St
- 3314 S Union St
- 606 Marion St
- 3508 Fairlane Dr
- 220 Virginia Ave
- 3514 SW 12th St
- 4204 SW 7th St
- 303 Virginia Ave
- 117 E Rose Ave
- 119 E Park Ave
- 612 Creston Ave
- 524 Miller Ave
- 602 Miller Ave
- 606 Miller Ave
- 522 Miller Ave
- 529 Thornton Ave
- 601 Thornton Ave
- 519 Thornton Ave
- 523 Miller Ave
- 523 Miller Ave
- 607 Thornton Ave
- 616 Miller Ave
- 601 Miller Ave
- 509 Thornton Ave
- 515 Miller Ave
- 607 Miller Ave
- 500 Miller Ave
- 3510 SW 5th St
- 617 Thornton Ave
- 3516 SW 5th St
- 617 Miller Ave