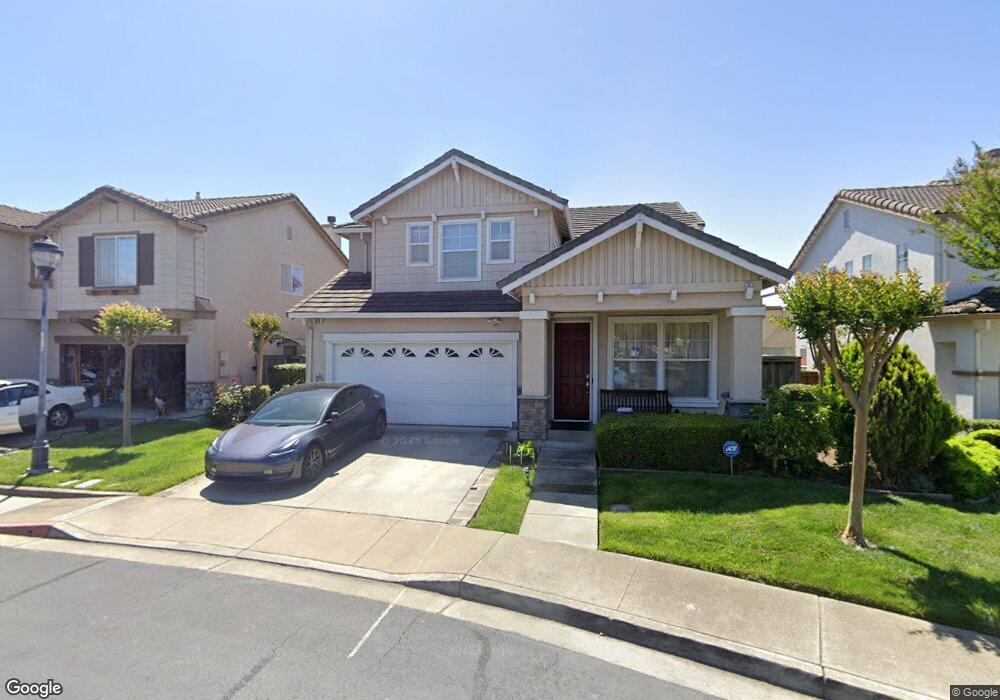
526 Monogram Rd San Leandro, CA 94577
Floresta Gardens-Bradrick NeighborhoodEstimated Value: $922,000 - $1,114,000
4
Beds
3
Baths
2,124
Sq Ft
$482/Sq Ft
Est. Value
About This Home
This home is located at 526 Monogram Rd, San Leandro, CA 94577 and is currently estimated at $1,023,799, approximately $482 per square foot. 526 Monogram Rd is a home located in Alameda County with nearby schools including Monroe Elementary School, John Muir Middle School, and San Leandro High School.
Ownership History
Date
Name
Owned For
Owner Type
Purchase Details
Closed on
Nov 22, 2010
Sold by
Lo David
Bought by
Lo Erica Lew
Current Estimated Value
Home Financials for this Owner
Home Financials are based on the most recent Mortgage that was taken out on this home.
Original Mortgage
$220,500
Outstanding Balance
$144,739
Interest Rate
4.17%
Mortgage Type
New Conventional
Estimated Equity
$879,060
Purchase Details
Closed on
Nov 19, 2010
Sold by
Lew Danny and Lew Toy Jin
Bought by
Lew Danny and Lew Toy Jin
Home Financials for this Owner
Home Financials are based on the most recent Mortgage that was taken out on this home.
Original Mortgage
$220,500
Outstanding Balance
$144,739
Interest Rate
4.17%
Mortgage Type
New Conventional
Estimated Equity
$879,060
Purchase Details
Closed on
Oct 16, 2000
Sold by
Ryland Homes Of California Inc
Bought by
Lew Danny and Lew Toy Jin
Home Financials for this Owner
Home Financials are based on the most recent Mortgage that was taken out on this home.
Original Mortgage
$250,000
Interest Rate
7.89%
Create a Home Valuation Report for This Property
The Home Valuation Report is an in-depth analysis detailing your home's value as well as a comparison with similar homes in the area
Home Values in the Area
Average Home Value in this Area
Purchase History
| Date | Buyer | Sale Price | Title Company |
|---|---|---|---|
| Lo Erica Lew | -- | Chicago Title Company | |
| Tran Leslie Lew | -- | Chicago Title Company | |
| Lew Danny | -- | Chicago Title Company | |
| Lew Danny | $377,500 | First American Title Guarant |
Source: Public Records
Mortgage History
| Date | Status | Borrower | Loan Amount |
|---|---|---|---|
| Open | Tran Leslie Lew | $220,500 | |
| Closed | Lew Danny | $250,000 |
Source: Public Records
Tax History
| Year | Tax Paid | Tax Assessment Tax Assessment Total Assessment is a certain percentage of the fair market value that is determined by local assessors to be the total taxable value of land and additions on the property. | Land | Improvement |
|---|---|---|---|---|
| 2025 | $7,535 | $568,187 | $171,767 | $396,420 |
| 2024 | $7,535 | $557,047 | $168,399 | $388,648 |
| 2023 | $7,557 | $546,127 | $165,098 | $381,029 |
| 2022 | $7,329 | $535,420 | $161,861 | $373,559 |
| 2021 | $7,122 | $524,923 | $158,688 | $366,235 |
| 2020 | $6,949 | $519,541 | $157,061 | $362,480 |
| 2019 | $6,731 | $509,356 | $153,982 | $355,374 |
| 2018 | $6,542 | $499,370 | $150,963 | $348,407 |
| 2017 | $6,415 | $489,580 | $148,003 | $341,577 |
| 2016 | $6,069 | $479,983 | $145,102 | $334,881 |
| 2015 | $5,956 | $472,777 | $142,924 | $329,853 |
| 2014 | $5,912 | $463,519 | $140,125 | $323,394 |
Source: Public Records
Map
Nearby Homes
- 3601 Figueroa Dr
- 14240 Rose Dr
- 391 Anza Way
- 475 Nabor St
- 15065 Hesperian Blvd Unit 22
- 14831 Bancroft Ave Unit Space 27
- 2399 E 14th St Unit 66
- 2399 E 14th St Unit 24
- 2399 E 14th St Unit 112
- 1316 135th Ave
- 15016 Fleming St
- 1250 Hubbard Ave
- 15040 Fleming St
- 15263 Hesperian Blvd Unit 13
- 15018 Edgemoor St
- 527 Colby St
- 15106 Edgemoor St
- 2144 Alvarado St
- 1343 Fargo Ave
- 2062 Washington Ave
- 3467 Monogram Rd
- 522 Monogram Rd
- 3465 Monogram Rd
- 520 Monogram Rd
- 3459 Monogram Rd
- 521 Monogram Rd
- 518 Monogram Rd
- 519 Monogram Rd
- 3451 Monogram Rd
- 3461 Monogram Rd
- 3463 Monogram Rd
- 3457 Monogram Rd
- 517 Monogram Rd
- 3455 Monogram Rd
- 516 Monogram Rd
- 3453 Monogram Rd
- 515 Monogram Rd
- 512 Monogram Rd
- 3445 Monogram St
- 513 Monogram Rd
Your Personal Tour Guide
Ask me questions while you tour the home.