Estimated Value: $316,819 - $423,000
Studio
--
Bath
1,872
Sq Ft
$201/Sq Ft
Est. Value
About This Home
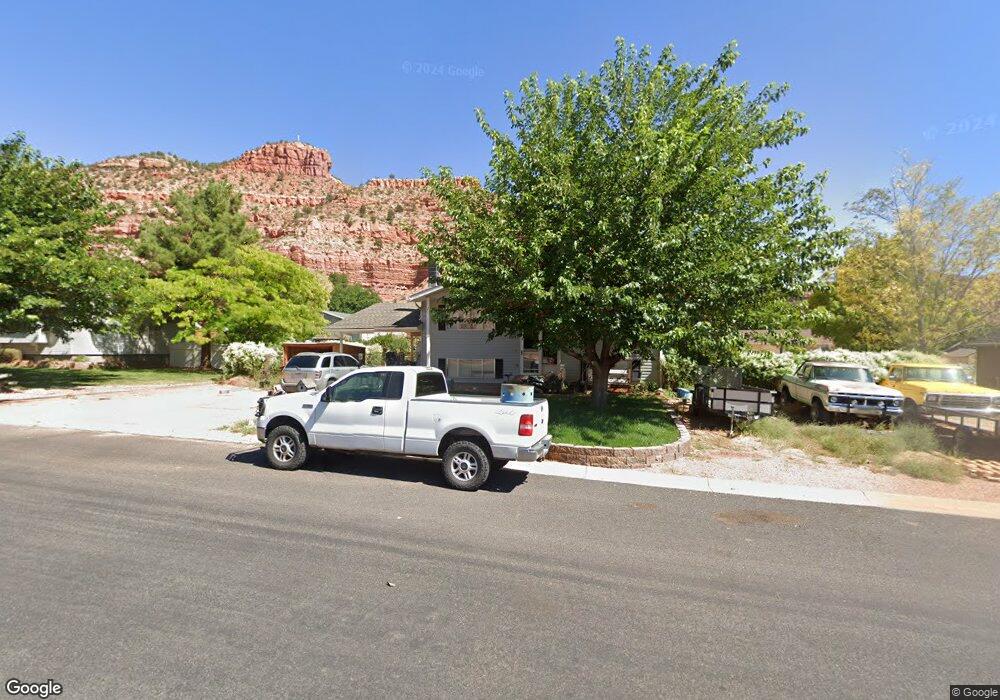
This home is located at 526 N 100 E, Kanab, UT 84741 and is currently estimated at $376,955, approximately $201 per square foot. 526 N 100 E is a home located in Kane County with nearby schools including Kanab Elementary School, Kanab Middle School, and Kanab High School.
Ownership History
Date
Name
Owned For
Owner Type
Purchase Details
Closed on
Jul 6, 2009
Sold by
Citifinancial Inc
Bought by
Citicorp Trust Bank Fsb
Current Estimated Value
Purchase Details
Closed on
Jan 28, 2008
Sold by
Citi Residential Lending Inc
Bought by
Lawyers Title Insurance Corp
Home Financials for this Owner
Home Financials are based on the most recent Mortgage that was taken out on this home.
Original Mortgage
$128,259
Interest Rate
6.3%
Purchase Details
Closed on
Dec 5, 2007
Sold by
Heaton Joel Lynn and Heaton Ladawn
Bought by
Heaton Joel Lynn and Heaton Ladawn
Home Financials for this Owner
Home Financials are based on the most recent Mortgage that was taken out on this home.
Original Mortgage
$128,259
Interest Rate
6.3%
Purchase Details
Closed on
Dec 21, 2006
Sold by
Heaton Joel Lynn and Heaton Ladawn
Bought by
Heaton Joel Lynn and Heaton Ladawn
Create a Home Valuation Report for This Property
The Home Valuation Report is an in-depth analysis detailing your home's value as well as a comparison with similar homes in the area
Home Values in the Area
Average Home Value in this Area
Purchase History
| Date | Buyer | Sale Price | Title Company |
|---|---|---|---|
| Citicorp Trust Bank Fsb | -- | -- | |
| Lawyers Title Insurance Corp | -- | -- | |
| Heaton Joel Lynn | -- | -- | |
| Heaton Joel Lynn | -- | -- | |
| Heaton Joel Lynn | -- | -- |
Source: Public Records
Mortgage History
| Date | Status | Borrower | Loan Amount |
|---|---|---|---|
| Previous Owner | Heaton Joel Lynn | $128,259 |
Source: Public Records
Tax History
| Year | Tax Paid | Tax Assessment Tax Assessment Total Assessment is a certain percentage of the fair market value that is determined by local assessors to be the total taxable value of land and additions on the property. | Land | Improvement |
|---|---|---|---|---|
| 2025 | $1,607 | $340,601 | $93,172 | $247,429 |
| 2024 | $1,691 | $196,496 | $46,164 | $150,332 |
| 2023 | $1,517 | $180,630 | $43,965 | $136,665 |
| 2022 | $1,341 | $158,061 | $33,820 | $124,241 |
| 2021 | $1,213 | $214,628 | $47,300 | $167,328 |
| 2020 | $1,173 | $201,443 | $43,000 | $158,443 |
| 2019 | $1,064 | $177,954 | $43,296 | $134,658 |
| 2018 | $1,029 | $170,738 | $36,080 | $134,658 |
| 2017 | $980 | $155,167 | $32,800 | $122,367 |
| 2016 | $877 | $134,861 | $32,800 | $102,061 |
| 2015 | $844 | $126,688 | $32,800 | $93,888 |
| 2014 | $844 | $129,163 | $35,128 | $94,035 |
| 2013 | -- | $71,039 | $0 | $0 |
Source: Public Records
Map
Nearby Homes
- 238 E 330 N
- 6 300 N
- 300 E 300 N
- 300 E 300 N Unit A3
- 300 E 300 N Unit A8
- 300 E 300 N Unit H6
- 320 W Los Barancos Ln
- 463 E Deadwood Dr
- 236 200
- 493 E Donner Cir
- 281 W Ladera Ln
- 297 N 100 W
- 61 W 200 N
- 484 E Mohawk Dr
- Lot 353 Rain Maker Rd
- 639 Rain Maker Rd
- 190 W Ladera Ln
- 587 E El Valle Dr
- 444 Ladera Ln
- 542 N Rusty
Your Personal Tour Guide
Ask me questions while you tour the home.