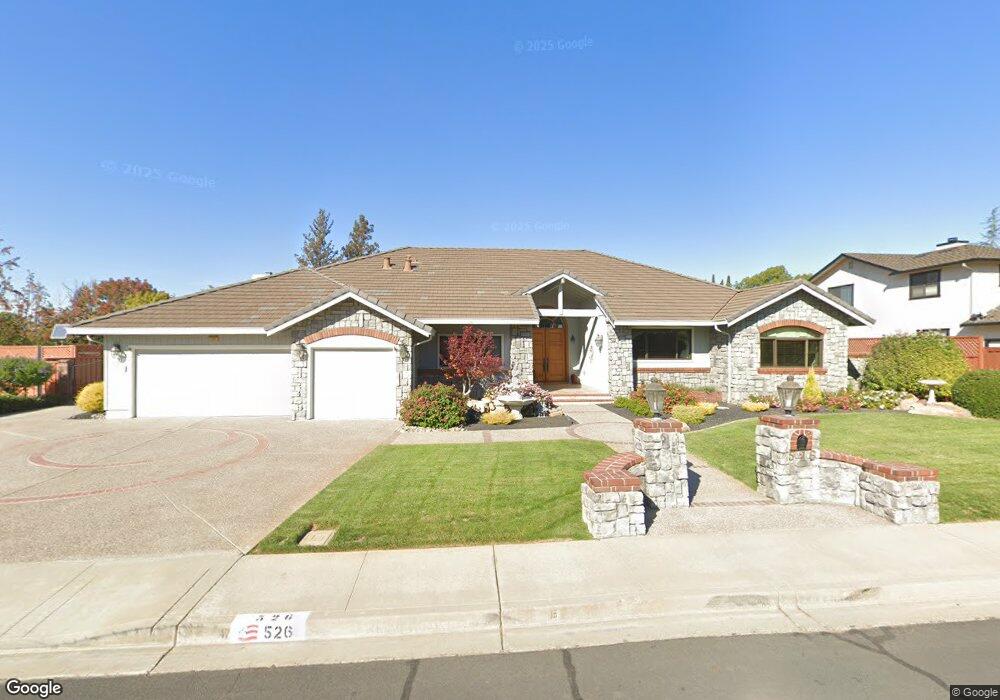
526 Rhea Way Livermore, CA 94550
Estimated Value: $1,920,000 - $2,190,956
4
Beds
3
Baths
3,485
Sq Ft
$595/Sq Ft
Est. Value
About This Home
This home is located at 526 Rhea Way, Livermore, CA 94550 and is currently estimated at $2,074,489, approximately $595 per square foot. 526 Rhea Way is a home located in Alameda County with nearby schools including Emma C. Smith Elementary School, Granada High School, and St Michael's School.
Ownership History
Date
Name
Owned For
Owner Type
Purchase Details
Closed on
Jul 28, 2010
Sold by
Harris Sharon J and The Harris 1992 Exemption Trus
Bought by
Harris Sharon J and Harris 1992 Trust
Current Estimated Value
Purchase Details
Closed on
Dec 6, 2001
Sold by
Harris Sharon J
Bought by
Harris Sharon J and The Harris 1992 Exemption Trus
Purchase Details
Closed on
Nov 4, 1999
Sold by
Harris Sharon J
Bought by
Harris Sharon J and Harris 1992 Trust
Purchase Details
Closed on
May 9, 1994
Sold by
Harris Richard L and Harris Sharon J
Bought by
Harris Richard L and Harris Sharon J
Home Financials for this Owner
Home Financials are based on the most recent Mortgage that was taken out on this home.
Original Mortgage
$227,000
Interest Rate
8.1%
Create a Home Valuation Report for This Property
The Home Valuation Report is an in-depth analysis detailing your home's value as well as a comparison with similar homes in the area
Home Values in the Area
Average Home Value in this Area
Purchase History
| Date | Buyer | Sale Price | Title Company |
|---|---|---|---|
| Harris Sharon J | -- | None Available | |
| Harris Sharon J | -- | -- | |
| Harris Sharon J | -- | -- | |
| Harris Richard L | -- | North American Title Co Inc |
Source: Public Records
Mortgage History
| Date | Status | Borrower | Loan Amount |
|---|---|---|---|
| Closed | Harris Richard L | $227,000 |
Source: Public Records
Tax History Compared to Growth
Tax History
| Year | Tax Paid | Tax Assessment Tax Assessment Total Assessment is a certain percentage of the fair market value that is determined by local assessors to be the total taxable value of land and additions on the property. | Land | Improvement |
|---|---|---|---|---|
| 2025 | $9,076 | $725,119 | $263,563 | $468,556 |
| 2024 | $9,076 | $710,764 | $258,395 | $459,369 |
| 2023 | $8,940 | $703,690 | $253,328 | $450,362 |
| 2022 | $8,810 | $682,894 | $248,362 | $441,532 |
| 2021 | $8,629 | $669,368 | $243,492 | $432,876 |
| 2020 | $8,376 | $669,434 | $240,996 | $428,438 |
| 2019 | $8,412 | $656,309 | $236,271 | $420,038 |
| 2018 | $8,232 | $643,443 | $231,639 | $411,804 |
| 2017 | $8,019 | $630,828 | $227,098 | $403,730 |
| 2016 | $7,721 | $618,461 | $222,646 | $395,815 |
| 2015 | $7,235 | $609,172 | $219,302 | $389,870 |
| 2014 | $7,107 | $597,239 | $215,006 | $382,233 |
Source: Public Records
Map
Nearby Homes
- 578 Regulus Rd
- 791 Via Del Sol
- 2304 White Oak Place
- 185 Campo Ct
- 259 Alden Ln
- 578 Escondido Cir
- 2461 Ancona Cir
- 2597 Ancona Cir
- 752 Barleta Ln
- 1734 Catalina Ct
- 1110 Lomitas Ave
- 967 Miranda Way
- 888 Laguna St
- 1037 Lexington Way
- 1164 Lexington Way
- 426 El Caminito
- 958 El Caminito
- 2157 Farmington Place
- 1237 Norwood Place
- 2276 Stonebridge Rd