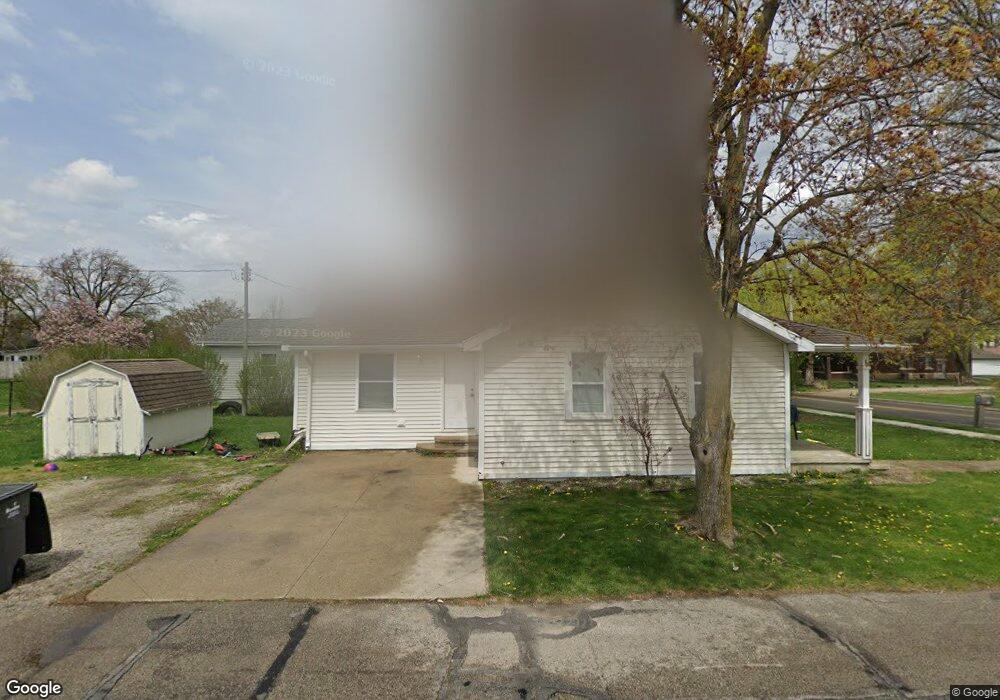
526 S Main St Topeka, IN 46571
Estimated Value: $149,000 - $176,000
3
Beds
1
Bath
1,032
Sq Ft
$158/Sq Ft
Est. Value
About This Home
This home is located at 526 S Main St, Topeka, IN 46571 and is currently estimated at $162,750, approximately $157 per square foot. 526 S Main St is a home located in LaGrange County with nearby schools including Topeka Elementary School, Westview Elementary School, and Westview Junior/Senior High School.
Ownership History
Date
Name
Owned For
Owner Type
Purchase Details
Closed on
Aug 27, 2020
Sold by
Thompson and Caressa
Bought by
Cleveland Marcie A
Current Estimated Value
Home Financials for this Owner
Home Financials are based on the most recent Mortgage that was taken out on this home.
Original Mortgage
$90,909
Outstanding Balance
$80,676
Interest Rate
2.9%
Mortgage Type
Construction
Estimated Equity
$82,074
Purchase Details
Closed on
May 8, 2017
Sold by
Yoder Robert K
Bought by
Thompson Robert and Thompson Caressa
Home Financials for this Owner
Home Financials are based on the most recent Mortgage that was taken out on this home.
Original Mortgage
$89,871
Interest Rate
4.14%
Mortgage Type
Construction
Create a Home Valuation Report for This Property
The Home Valuation Report is an in-depth analysis detailing your home's value as well as a comparison with similar homes in the area
Home Values in the Area
Average Home Value in this Area
Purchase History
| Date | Buyer | Sale Price | Title Company |
|---|---|---|---|
| Cleveland Marcie A | $113,636 | Metropolitan Title Co | |
| Thompson Robert | $88,073 | -- |
Source: Public Records
Mortgage History
| Date | Status | Borrower | Loan Amount |
|---|---|---|---|
| Open | Cleveland Marcie A | $90,909 | |
| Previous Owner | Thompson Robert | $89,871 |
Source: Public Records
Tax History Compared to Growth
Tax History
| Year | Tax Paid | Tax Assessment Tax Assessment Total Assessment is a certain percentage of the fair market value that is determined by local assessors to be the total taxable value of land and additions on the property. | Land | Improvement |
|---|---|---|---|---|
| 2024 | $572 | $91,600 | $21,200 | $70,400 |
| 2023 | $483 | $89,100 | $20,600 | $68,500 |
| 2022 | $402 | $79,300 | $17,200 | $62,100 |
| 2021 | $349 | $69,700 | $16,300 | $53,400 |
| 2020 | $334 | $65,500 | $15,800 | $49,700 |
| 2019 | $1,473 | $64,600 | $15,800 | $48,800 |
| 2018 | $1,495 | $66,000 | $15,800 | $50,200 |
| 2017 | $1,112 | $51,100 | $15,800 | $35,300 |
| 2016 | $1,055 | $52,700 | $15,800 | $36,900 |
| 2014 | $1,030 | $51,400 | $15,800 | $35,600 |
| 2013 | $1,030 | $51,800 | $15,800 | $36,000 |
Source: Public Records
Map
Nearby Homes