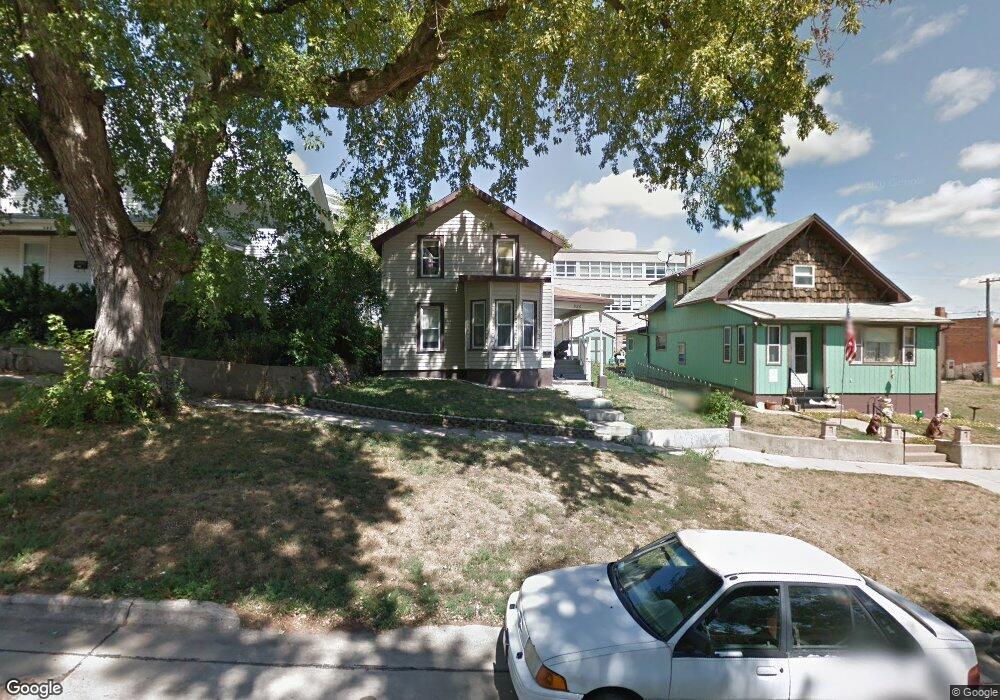
526 W Maple St Unit St Cherokee, IA 51012
Estimated Value: $85,000 - $102,000
2
Beds
1
Bath
1,262
Sq Ft
$74/Sq Ft
Est. Value
About This Home
This home is located at 526 W Maple St Unit St, Cherokee, IA 51012 and is currently estimated at $93,979, approximately $74 per square foot. 526 W Maple St Unit St is a home located in Cherokee County with nearby schools including Cherokee Elementary School and Cherokee Middle School.
Ownership History
Date
Name
Owned For
Owner Type
Purchase Details
Closed on
Aug 21, 2025
Sold by
Laine Cathy and Castellanos Jesus Carlos
Bought by
Bogges Jessica Lane
Current Estimated Value
Home Financials for this Owner
Home Financials are based on the most recent Mortgage that was taken out on this home.
Original Mortgage
$95,424
Outstanding Balance
$95,341
Interest Rate
6.72%
Mortgage Type
New Conventional
Estimated Equity
-$1,362
Purchase Details
Closed on
Jun 3, 2024
Sold by
Smith Nile J and Smith Susan J
Bought by
Laine Cathy and Castellanos Jesus Carlos
Create a Home Valuation Report for This Property
The Home Valuation Report is an in-depth analysis detailing your home's value as well as a comparison with similar homes in the area
Home Values in the Area
Average Home Value in this Area
Purchase History
| Date | Buyer | Sale Price | Title Company |
|---|---|---|---|
| Bogges Jessica Lane | $90,000 | None Listed On Document | |
| Laine Cathy | $32,000 | None Listed On Document |
Source: Public Records
Mortgage History
| Date | Status | Borrower | Loan Amount |
|---|---|---|---|
| Open | Bogges Jessica Lane | $95,424 |
Source: Public Records
Tax History
| Year | Tax Paid | Tax Assessment Tax Assessment Total Assessment is a certain percentage of the fair market value that is determined by local assessors to be the total taxable value of land and additions on the property. | Land | Improvement |
|---|---|---|---|---|
| 2025 | $766 | $107,760 | $6,460 | $101,300 |
| 2024 | $941 | $46,160 | $6,460 | $39,700 |
| 2023 | $914 | $46,160 | $6,460 | $39,700 |
| 2022 | $536 | $38,090 | $4,850 | $33,240 |
| 2021 | $536 | $38,090 | $4,850 | $33,240 |
| 2020 | $554 | $38,090 | $4,850 | $33,240 |
| 2019 | $760 | $38,090 | $0 | $0 |
| 2018 | $596 | $30,594 | $0 | $0 |
| 2017 | $1,027 | $30,594 | $0 | $0 |
| 2016 | $592 | $30,594 | $0 | $0 |
| 2015 | $518 | $26,149 | $0 | $0 |
| 2014 | $518 | $26,149 | $0 | $0 |
Source: Public Records
Map
Nearby Homes
Your Personal Tour Guide
Ask me questions while you tour the home.