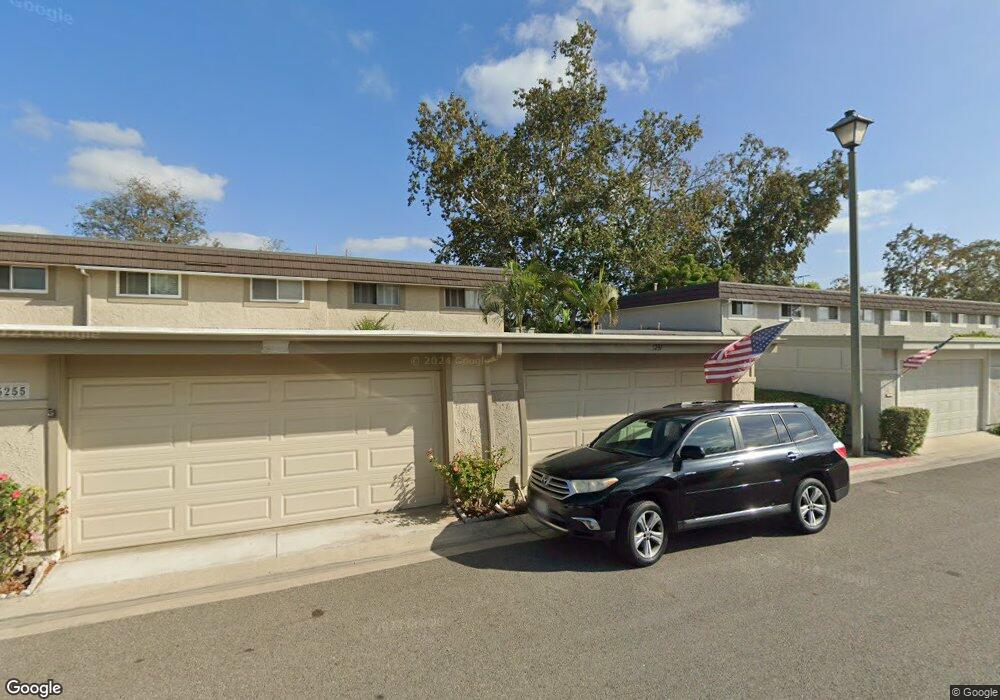
5261 Charing Cross Rd Westminster, CA 92683
Estimated Value: $888,000 - $1,040,000
3
Beds
3
Baths
1,367
Sq Ft
$682/Sq Ft
Est. Value
About This Home
This home is located at 5261 Charing Cross Rd, Westminster, CA 92683 and is currently estimated at $932,817, approximately $682 per square foot. 5261 Charing Cross Rd is a home located in Orange County with nearby schools including Eastwood Elementary School, Helen Stacey Intermediate School, and Westminster High School.
Ownership History
Date
Name
Owned For
Owner Type
Purchase Details
Closed on
Dec 17, 2014
Sold by
Moore John E and Moore Patricia J
Bought by
The Moore 2014 Family Trust
Current Estimated Value
Purchase Details
Closed on
Jun 1, 2005
Sold by
Perez Robert J and Lewis Katherine E
Bought by
Moore John E and Moore Patricia J
Home Financials for this Owner
Home Financials are based on the most recent Mortgage that was taken out on this home.
Original Mortgage
$335,000
Outstanding Balance
$174,440
Interest Rate
5.72%
Mortgage Type
Fannie Mae Freddie Mac
Estimated Equity
$758,377
Purchase Details
Closed on
Feb 13, 2004
Sold by
Perez Robert J and Lewis Katherine E
Bought by
Perez Robert J and Lewis Katherine E
Purchase Details
Closed on
Jan 16, 1998
Sold by
Buccola James A and Buccola Mary K
Bought by
Perez Robert J
Home Financials for this Owner
Home Financials are based on the most recent Mortgage that was taken out on this home.
Original Mortgage
$155,000
Interest Rate
6.9%
Create a Home Valuation Report for This Property
The Home Valuation Report is an in-depth analysis detailing your home's value as well as a comparison with similar homes in the area
Home Values in the Area
Average Home Value in this Area
Purchase History
| Date | Buyer | Sale Price | Title Company |
|---|---|---|---|
| The Moore 2014 Family Trust | -- | None Available | |
| Moore John E | $575,000 | Alliance Title | |
| Perez Robert J | -- | -- | |
| Perez Robert J | $175,000 | Lawyers Title Company |
Source: Public Records
Mortgage History
| Date | Status | Borrower | Loan Amount |
|---|---|---|---|
| Open | Moore John E | $335,000 | |
| Previous Owner | Perez Robert J | $155,000 |
Source: Public Records
Tax History
| Year | Tax Paid | Tax Assessment Tax Assessment Total Assessment is a certain percentage of the fair market value that is determined by local assessors to be the total taxable value of land and additions on the property. | Land | Improvement |
|---|---|---|---|---|
| 2025 | $9,430 | $801,493 | $653,501 | $147,992 |
| 2024 | $9,430 | $785,778 | $640,687 | $145,091 |
| 2023 | $7,776 | $648,397 | $531,170 | $117,227 |
| 2022 | $7,658 | $635,684 | $520,755 | $114,929 |
| 2021 | $7,475 | $623,220 | $510,544 | $112,676 |
| 2020 | $7,458 | $623,220 | $510,544 | $112,676 |
| 2019 | $7,374 | $611,000 | $500,533 | $110,467 |
| 2018 | $6,969 | $563,000 | $452,533 | $110,467 |
| 2017 | $6,828 | $563,000 | $452,533 | $110,467 |
| 2016 | $6,070 | $502,000 | $391,533 | $110,467 |
| 2015 | $6,050 | $502,000 | $391,533 | $110,467 |
| 2014 | $5,190 | $425,000 | $314,533 | $110,467 |
Source: Public Records
Map
Nearby Homes
- 5321 Victoria Place
- 14241 Blackpool Rd
- 5213 Piccadilly Cir
- 5006 Hampton Ct
- 5212 Somerset St
- 14492 Spa Dr
- 5631 Nevada Dr
- 5566 Aldershot Walk
- 13822 Marquette St
- 5332 Loyola Ave
- 5071 Cambridge Ave
- 13731 Claremont St
- 14432 Windfall Ln
- 13722 Hammon Place
- 6052 Mahogany Ave
- 6021 Ivory Cir
- 5382 Laverne Cir
- 14481 Fairview Ln
- 5302 Clark Cir
- 6216 Hefley St Unit 3
- 5255 Charing Cross Rd
- 5271 Charing Cross Rd
- 5251 Charing Cross Rd
- 5245 Charing Cross Rd
- 5281 Charing Cross Rd
- 5241 Charing Cross Rd
- 5285 Charing Cross Rd
- 5262 Charing Cross Rd
- 5256 Charing Cross Rd
- 5235 Charing Cross Rd
- 5272 Charing Cross Rd
- 5252 Charing Cross Rd
- 5276 Charing Cross Rd
- 5291 Charing Cross Rd
- 5261 Tufton St
- 5246 Charing Cross Rd
- 5265 Tufton St
- 5282 Charing Cross Rd
- 5231 Charing Cross Rd
- 5242 Charing Cross Rd
Your Personal Tour Guide
Ask me questions while you tour the home.