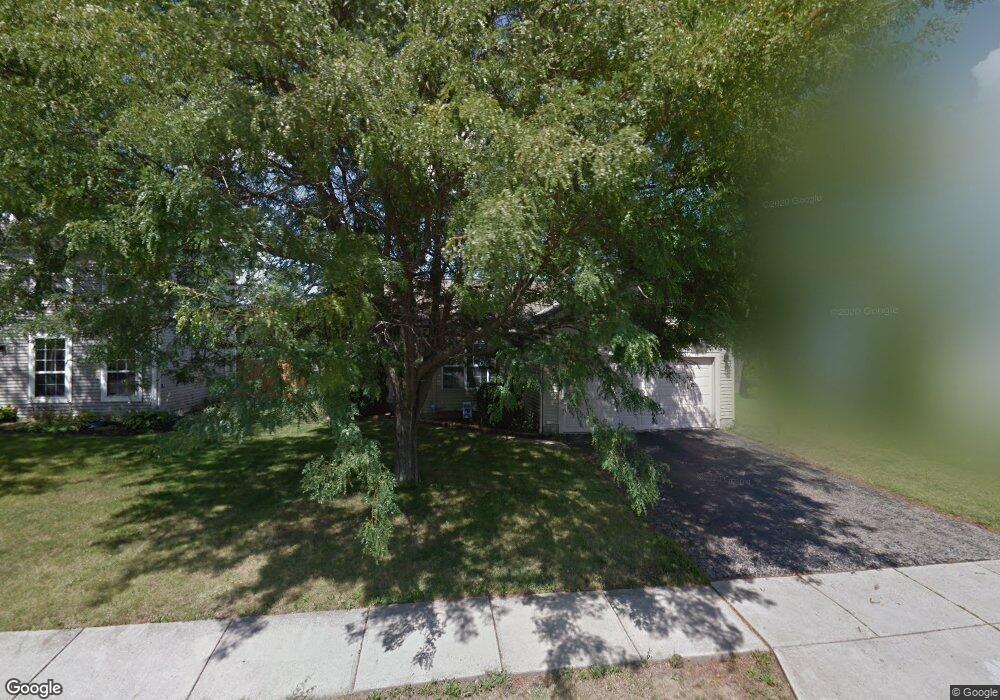
5262 Redlands Dr Hilliard, OH 43026
Cross Creek NeighborhoodEstimated Value: $339,000 - $362,000
3
Beds
2
Baths
1,710
Sq Ft
$204/Sq Ft
Est. Value
About This Home
This home is located at 5262 Redlands Dr, Hilliard, OH 43026 and is currently estimated at $349,496, approximately $204 per square foot. 5262 Redlands Dr is a home located in Franklin County with nearby schools including Hilliard Crossing Elementary School, Hilliard Station Sixth Grade Elementary School, and Hilliard Heritage Middle School.
Ownership History
Date
Name
Owned For
Owner Type
Purchase Details
Closed on
Mar 26, 2019
Sold by
Anderson Catherine N
Bought by
Lamonde Marjorie and Lamonde Robert R
Current Estimated Value
Home Financials for this Owner
Home Financials are based on the most recent Mortgage that was taken out on this home.
Original Mortgage
$209,950
Outstanding Balance
$183,065
Interest Rate
4.3%
Mortgage Type
New Conventional
Estimated Equity
$166,431
Purchase Details
Closed on
May 28, 2008
Sold by
Mellett Kathryn M and Mellett Kevin M
Bought by
Anderson Catherine N
Home Financials for this Owner
Home Financials are based on the most recent Mortgage that was taken out on this home.
Original Mortgage
$138,320
Interest Rate
5.93%
Mortgage Type
Purchase Money Mortgage
Purchase Details
Closed on
Aug 28, 2003
Sold by
Spiegelberg Greg and Spiegelberg Amy P
Bought by
Mellett Kathryn M
Home Financials for this Owner
Home Financials are based on the most recent Mortgage that was taken out on this home.
Original Mortgage
$148,824
Interest Rate
6.18%
Mortgage Type
FHA
Purchase Details
Closed on
Apr 24, 1998
Sold by
Peecook John B
Bought by
Spiegelberg Greg
Purchase Details
Closed on
Aug 2, 1993
Create a Home Valuation Report for This Property
The Home Valuation Report is an in-depth analysis detailing your home's value as well as a comparison with similar homes in the area
Home Values in the Area
Average Home Value in this Area
Purchase History
| Date | Buyer | Sale Price | Title Company |
|---|---|---|---|
| Lamonde Marjorie | $221,000 | First Ohio Title Insurance | |
| Anderson Catherine N | $172,900 | Talon Group | |
| Mellett Kathryn M | $150,000 | Real Living Title | |
| Spiegelberg Greg | $119,500 | Chicago Title West | |
| -- | $98,500 | -- |
Source: Public Records
Mortgage History
| Date | Status | Borrower | Loan Amount |
|---|---|---|---|
| Open | Lamonde Marjorie | $209,950 | |
| Closed | Anderson Catherine N | $138,320 | |
| Previous Owner | Mellett Kathryn M | $148,824 |
Source: Public Records
Tax History
| Year | Tax Paid | Tax Assessment Tax Assessment Total Assessment is a certain percentage of the fair market value that is determined by local assessors to be the total taxable value of land and additions on the property. | Land | Improvement |
|---|---|---|---|---|
| 2025 | $5,592 | $99,020 | $29,370 | $69,650 |
| 2024 | $5,592 | $99,020 | $29,370 | $69,650 |
| 2023 | $4,845 | $99,015 | $29,365 | $69,650 |
| 2022 | $4,280 | $70,040 | $15,120 | $54,920 |
| 2021 | $4,275 | $70,040 | $15,120 | $54,920 |
| 2020 | $4,263 | $70,040 | $15,120 | $54,920 |
| 2019 | $3,922 | $55,020 | $12,110 | $42,910 |
| 2018 | $3,935 | $55,020 | $12,110 | $42,910 |
| 2017 | $3,906 | $55,020 | $12,110 | $42,910 |
| 2016 | $4,229 | $55,170 | $11,660 | $43,510 |
| 2015 | $3,963 | $55,170 | $11,660 | $43,510 |
| 2014 | $3,970 | $55,170 | $11,660 | $43,510 |
| 2013 | $1,915 | $52,535 | $11,095 | $41,440 |
Source: Public Records
Map
Nearby Homes
- 5380 Carjan Way
- 5288 Hyde Park Dr
- 5176 Skytrail Dr
- 4568 Addison Ln N
- 4559 Addison Ln N
- 5160 Singleton Dr Unit 43D
- 5358 Beringer Dr
- 2921 Mondavi Ln
- 3150 Hilliard Rome Rd
- 5082 Springdale Blvd Unit 31E
- 5080 Stoneybrook Blvd Unit 2D
- 5082 Singleton Dr Unit 29C
- 5083 Singleton Dr Unit 33b
- 5483 Thorney Dr
- 2928 Culver Dr
- 5052 Bressler Dr
- 3045 Bohlen Dr
- 3395 Reed Point Dr
- 5570 Oldwynne Rd
- 5138 Roberts Rd
- 5254 Redlands Dr
- 5270 Redlands Dr
- 3001 Galen Ct
- 5240 Redlands Dr
- 2984 Parker Ln
- 2992 Parker Ln
- 5261 Redlands Dr
- 5253 Redlands Dr
- 3000 Galen Ct
- 5273 Redlands Dr
- 3000 Parker Ln
- 5245 Redlands Dr
- 3015 Galen Ct
- 3008 Parker Ln
- 5224 Redlands Dr
- 3008 Galen Ct
- 5231 Redlands Dr
- 5265 Citrus Dr
- 5426 Richlanne Dr
- 5297 Redlands Dr
Your Personal Tour Guide
Ask me questions while you tour the home.