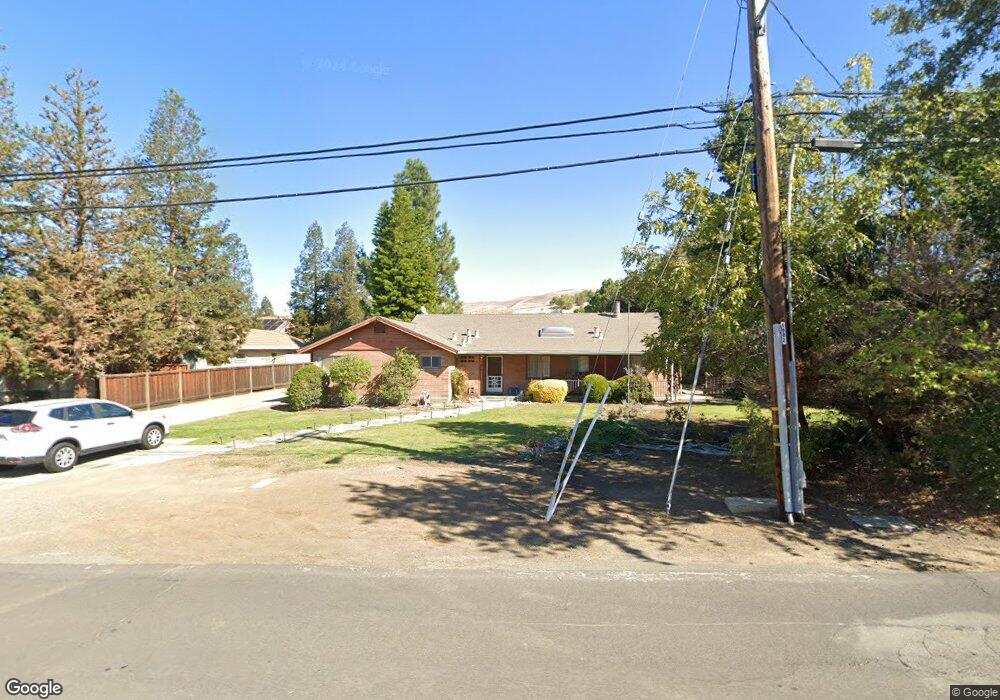
5265 Laurel Dr Concord, CA 94521
Rose Glen NeighborhoodEstimated Value: $1,007,000 - $1,103,000
3
Beds
2
Baths
2,274
Sq Ft
$466/Sq Ft
Est. Value
About This Home
This home is located at 5265 Laurel Dr, Concord, CA 94521 and is currently estimated at $1,059,085, approximately $465 per square foot. 5265 Laurel Dr is a home located in Contra Costa County with nearby schools including Ayers Elementary School, Pine Hollow Middle School, and College Park High School.
Ownership History
Date
Name
Owned For
Owner Type
Purchase Details
Closed on
Mar 2, 2024
Sold by
Damiano Anthony P and Damiano Marcia R
Bought by
Secreto Christina Lynn and Webb Billy Ray
Current Estimated Value
Home Financials for this Owner
Home Financials are based on the most recent Mortgage that was taken out on this home.
Original Mortgage
$760,000
Outstanding Balance
$747,287
Interest Rate
6.6%
Mortgage Type
New Conventional
Estimated Equity
$311,798
Purchase Details
Closed on
May 23, 2017
Sold by
Fackreil Keith
Bought by
Damiano Anthony P and Damiano Marcia R
Purchase Details
Closed on
Feb 8, 2017
Sold by
Fackrell Keith
Bought by
Damiano Anthony and Damiano Marcia
Home Financials for this Owner
Home Financials are based on the most recent Mortgage that was taken out on this home.
Original Mortgage
$475,000
Interest Rate
4.2%
Mortgage Type
Unknown
Purchase Details
Closed on
Oct 13, 1999
Sold by
Fackrell Ivan D and Fackrell Norma D
Bought by
Fackrell Ivan and Fackrell Norma
Create a Home Valuation Report for This Property
The Home Valuation Report is an in-depth analysis detailing your home's value as well as a comparison with similar homes in the area
Home Values in the Area
Average Home Value in this Area
Purchase History
| Date | Buyer | Sale Price | Title Company |
|---|---|---|---|
| Secreto Christina Lynn | $950,000 | Old Republic Title | |
| Damiano Anthony P | -- | Fidelity National Title Co | |
| Damiano Anthony | $440,000 | Fidelity National Title Co | |
| Fackrell Ivan | -- | -- |
Source: Public Records
Mortgage History
| Date | Status | Borrower | Loan Amount |
|---|---|---|---|
| Open | Secreto Christina Lynn | $760,000 | |
| Previous Owner | Damiano Anthony | $475,000 |
Source: Public Records
Tax History
| Year | Tax Paid | Tax Assessment Tax Assessment Total Assessment is a certain percentage of the fair market value that is determined by local assessors to be the total taxable value of land and additions on the property. | Land | Improvement |
|---|---|---|---|---|
| 2025 | $11,730 | $969,000 | $612,000 | $357,000 |
| 2024 | $8,100 | $659,935 | $471,058 | $188,877 |
| 2023 | $8,100 | $646,996 | $461,822 | $185,174 |
| 2022 | $7,995 | $634,311 | $452,767 | $181,544 |
| 2021 | $7,802 | $621,875 | $443,890 | $177,985 |
| 2019 | $7,657 | $603,431 | $430,725 | $172,706 |
| 2018 | $7,370 | $591,600 | $422,280 | $169,320 |
| 2017 | $1,764 | $93,766 | $27,031 | $66,735 |
| 2016 | $1,685 | $91,928 | $26,501 | $65,427 |
| 2015 | $1,632 | $90,548 | $26,103 | $64,445 |
| 2014 | $1,572 | $88,775 | $25,592 | $63,183 |
Source: Public Records
Map
Nearby Homes
- 5248 Concord Blvd
- 5174 Jomar Dr
- 5169 Concord Blvd
- 1941 Springridge Ct
- 5425 Concord Blvd Unit A4
- 5425 Concord Blvd Unit H2
- 1505 Kirker Pass Rd Unit 170
- 1505 Kirker Pass Rd Unit 164
- 1505 Kirker Pass Rd Unit 119
- 1956 Holly Dr
- 5454 Anselmo Ct
- 1520 Schenone Ct Unit 15
- 1531 Garcez Dr
- 1515 Ohara Ct
- 5179 Paul Scarlet Dr
- 1833 Camino Estrada
- 1560 Ayers Rd
- 5581 Gonzalez Ct
- 2175 Bluerock Cir
- 5333 Park Highlands Blvd Unit 27
Your Personal Tour Guide
Ask me questions while you tour the home.