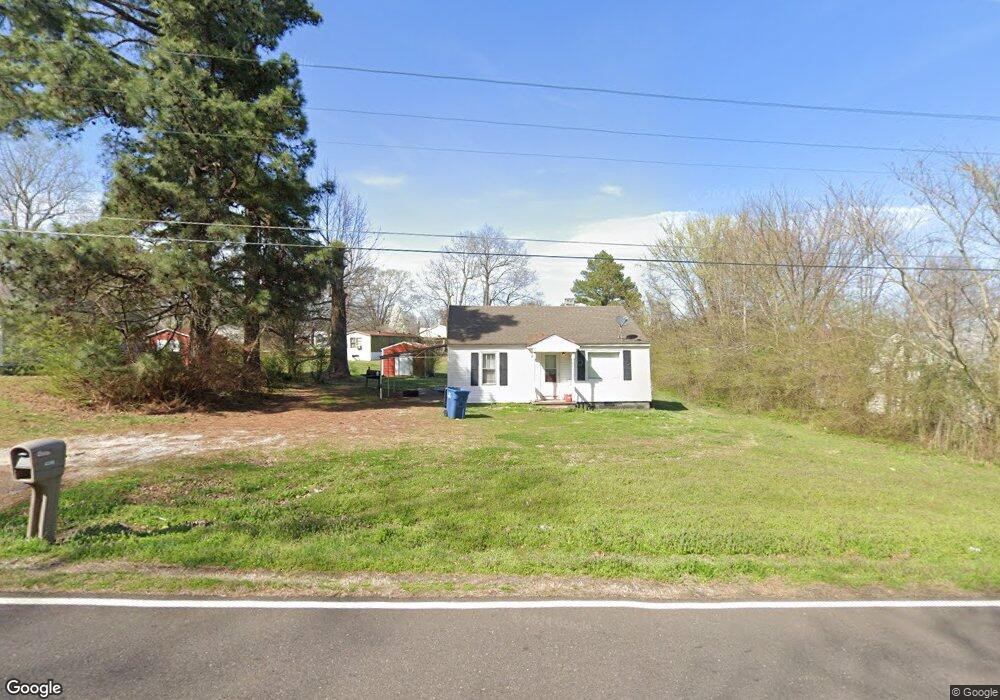
5265 Main St Trezevant, TN 38258
Estimated Value: $125,652 - $241,000
Studio
1
Bath
2,658
Sq Ft
$67/Sq Ft
Est. Value
About This Home
This home is located at 5265 Main St, Trezevant, TN 38258 and is currently estimated at $178,163, approximately $67 per square foot. 5265 Main St is a home located in Carroll County with nearby schools including West Carroll Primary School, West Carroll Elementary School, and West Carroll Junior/Senior High School.
Ownership History
Date
Name
Owned For
Owner Type
Purchase Details
Closed on
Nov 7, 2018
Sold by
Towater Jeffery L
Bought by
Mccormick Deanna Lynne and Mccormick Douglas
Current Estimated Value
Purchase Details
Closed on
Sep 19, 2011
Sold by
Cathey Kaye Metts
Bought by
Towater Jeff
Purchase Details
Closed on
Mar 13, 2001
Sold by
Powell J W Nancy
Bought by
Cathey Kaye Metts
Purchase Details
Closed on
Sep 10, 1996
Sold by
Griffith Jimmy
Bought by
Chaney Billy R
Purchase Details
Closed on
Aug 19, 1994
Bought by
Griffith Jimmyk Betty
Purchase Details
Closed on
Sep 18, 1985
Bought by
Richards James R and Richards Candyce D
Create a Home Valuation Report for This Property
The Home Valuation Report is an in-depth analysis detailing your home's value as well as a comparison with similar homes in the area
Purchase History
| Date | Buyer | Sale Price | Title Company |
|---|---|---|---|
| Mccormick Deanna Lynne | $100,000 | -- | |
| Towater Jeff | $42,000 | -- | |
| Cathey Kaye Metts | $18,000 | -- | |
| Chaney Billy R | $25,000 | -- | |
| Griffith Jimmyk Betty | $11,000 | -- | |
| Richards James R | -- | -- |
Source: Public Records
Tax History
| Year | Tax Paid | Tax Assessment Tax Assessment Total Assessment is a certain percentage of the fair market value that is determined by local assessors to be the total taxable value of land and additions on the property. | Land | Improvement |
|---|---|---|---|---|
| 2025 | $554 | $27,100 | $1,700 | $25,400 |
| 2024 | $520 | $15,825 | $1,125 | $14,700 |
| 2023 | $520 | $15,825 | $1,125 | $14,700 |
| 2022 | $520 | $15,825 | $1,125 | $14,700 |
| 2021 | $327 | $15,825 | $1,125 | $14,700 |
| 2020 | $520 | $15,825 | $1,125 | $14,700 |
| 2019 | $467 | $12,925 | $1,125 | $11,800 |
| 2018 | $459 | $12,925 | $1,125 | $11,800 |
| 2017 | $459 | $12,725 | $1,125 | $11,600 |
| 2016 | $631 | $12,725 | $1,125 | $11,600 |
| 2015 | $472 | $12,725 | $1,125 | $11,600 |
| 2014 | $486 | $12,725 | $1,125 | $11,600 |
| 2013 | $486 | $12,853 | $0 | $0 |
Source: Public Records
Map
Nearby Homes
- 3040 Tennessee 77
- 1100 Power Station Rd
- 95 Railroad St
- 2700 Independence Rd
- 3875 Terry Rd
- 0 Windy Pines Ln Unit 2501569
- 605 Oak Grove Rd
- 1740 Highway 436
- 30 Ledsinger Rd
- 1588 Highway 190
- 2725 U S 79
- 285 Peggy Ln
- 0 Oak Ln
- 3265 New Zion Rd
- 0 Hwy 77 Browning Dr Unit 135192
- 4506 Hamilton St
- 110 Glover St
- 0 Lakewood Lake Ln
- 0 Lakewood Lake Ln Unit Huntingdon TN 38344
- 4760 Hamilton St
Your Personal Tour Guide
Ask me questions while you tour the home.