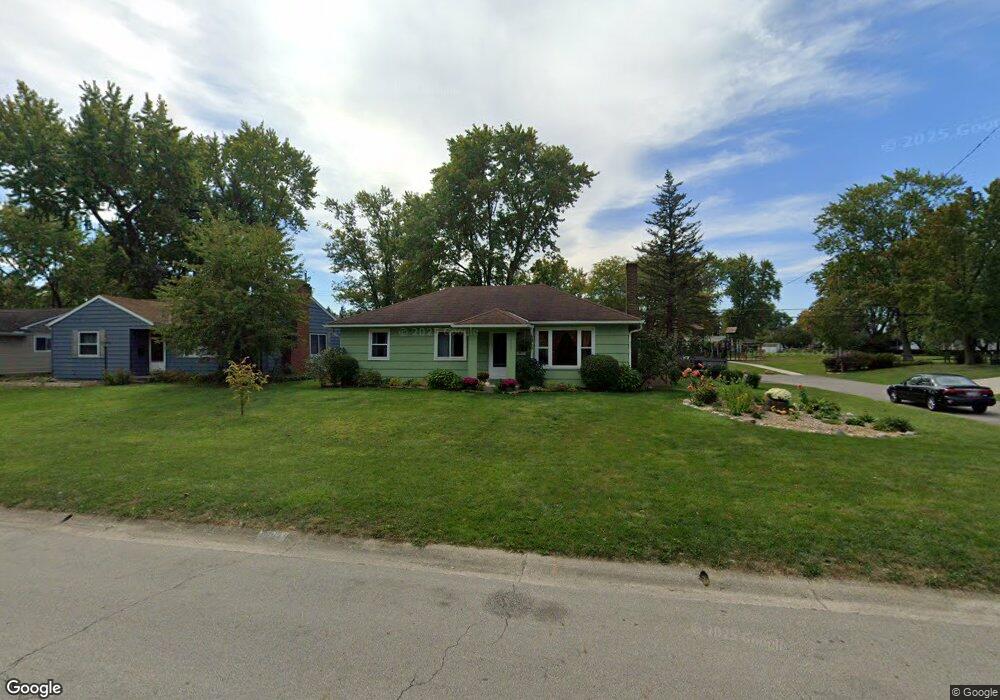
5267 Conklin Dr Hilliard, OH 43026
Estimated Value: $265,992 - $292,000
3
Beds
1
Bath
1,000
Sq Ft
$274/Sq Ft
Est. Value
About This Home
This home is located at 5267 Conklin Dr, Hilliard, OH 43026 and is currently estimated at $274,498, approximately $274 per square foot. 5267 Conklin Dr is a home located in Franklin County with nearby schools including Scioto Darby Elementary School, Hilliard Station Sixth Grade Elementary School, and Hilliard Heritage Middle School.
Ownership History
Date
Name
Owned For
Owner Type
Purchase Details
Closed on
May 17, 2002
Sold by
Ricciardo Shannon T and Ricciardo Jennifer R
Bought by
Boyd Christopher and Boyd Jodi C
Current Estimated Value
Home Financials for this Owner
Home Financials are based on the most recent Mortgage that was taken out on this home.
Original Mortgage
$122,482
Outstanding Balance
$51,974
Interest Rate
7%
Mortgage Type
FHA
Estimated Equity
$222,524
Purchase Details
Closed on
May 22, 2000
Sold by
Richards William L and Cole Linda L
Bought by
Ricciardo Shannon T and Ricciardo Jennifer R
Home Financials for this Owner
Home Financials are based on the most recent Mortgage that was taken out on this home.
Original Mortgage
$82,800
Interest Rate
8.13%
Purchase Details
Closed on
Sep 19, 1978
Bought by
Richards William L
Create a Home Valuation Report for This Property
The Home Valuation Report is an in-depth analysis detailing your home's value as well as a comparison with similar homes in the area
Home Values in the Area
Average Home Value in this Area
Purchase History
| Date | Buyer | Sale Price | Title Company |
|---|---|---|---|
| Boyd Christopher | $123,500 | Chicago Title | |
| Ricciardo Shannon T | $103,500 | -- | |
| Richards William L | $48,000 | -- |
Source: Public Records
Mortgage History
| Date | Status | Borrower | Loan Amount |
|---|---|---|---|
| Open | Boyd Christopher | $122,482 | |
| Closed | Ricciardo Shannon T | $82,800 |
Source: Public Records
Tax History Compared to Growth
Tax History
| Year | Tax Paid | Tax Assessment Tax Assessment Total Assessment is a certain percentage of the fair market value that is determined by local assessors to be the total taxable value of land and additions on the property. | Land | Improvement |
|---|---|---|---|---|
| 2024 | $4,671 | $69,730 | $23,000 | $46,730 |
| 2023 | $3,803 | $69,720 | $22,995 | $46,725 |
| 2022 | $5,209 | $50,680 | $16,170 | $34,510 |
| 2021 | $3,471 | $50,680 | $16,170 | $34,510 |
| 2020 | $3,462 | $50,680 | $16,170 | $34,510 |
| 2019 | $3,264 | $40,670 | $12,950 | $27,720 |
| 2018 | $3,303 | $40,670 | $12,950 | $27,720 |
| 2017 | $3,401 | $40,670 | $12,950 | $27,720 |
| 2016 | $3,550 | $41,090 | $13,650 | $27,440 |
| 2015 | $3,352 | $41,090 | $13,650 | $27,440 |
| 2014 | $3,358 | $41,090 | $13,650 | $27,440 |
| 2013 | $1,704 | $41,090 | $13,650 | $27,440 |
Source: Public Records
Map
Nearby Homes
- 5220 Conklin Dr
- 5258 Scioto Darby Rd
- 3617 Heywood Dr
- 5251 Bigelow Dr
- 5190 Bigelow Dr
- 3661 Patty Ln
- 5137 Drivemere Rd
- 5155 Drivemere Rd
- 5293 Williamsburg Cir
- 5340 Carolyn Dr
- 5126 Bigelow Dr
- 5577 E Links Blvd
- 5605 Brickstone Place Unit 75605
- 4967 Carroll Ct
- 5414 Bonner Ct
- 4933 Travers Ct
- 5644 Newington Dr
- 5222 Bonner Dr
- 3127 Stouenburgh Dr
- 3643 Carriage Run Dr
- 5259 Conklin Dr
- 5285 Conklin Dr
- 5255 Conklin Dr
- 5293 Conklin Dr
- 5247 Conklin Dr
- 5276 Conklin Dr
- 5262 Conklin Dr
- 5284 Conklin Dr
- 5254 Conklin Dr
- 5282 Wakefield Dr
- 5303 Conklin Dr
- 5290 Wakefield Dr
- 5274 Wakefield Dr
- 5292 Conklin Dr
- 5244 Conklin Dr
- 5243 Conklin Dr
- 5298 Wakefield Dr
- 5270 Wakefield Dr
- 5308 Wakefield Dr
- 5300 Conklin Dr