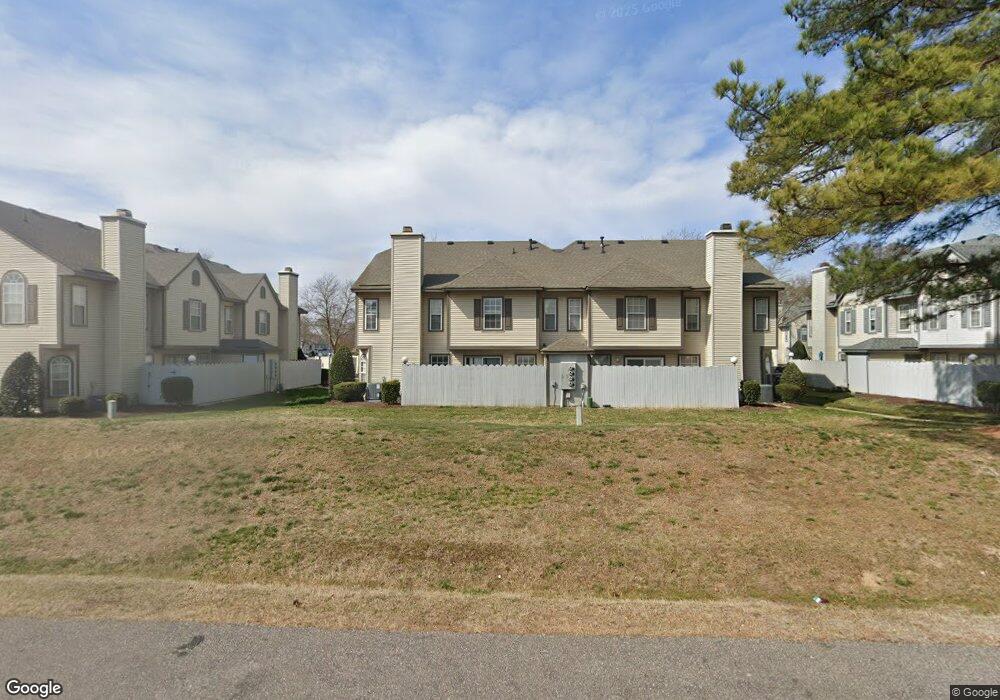
5268 Bardith Cir Virginia Beach, VA 23455
Bayside NeighborhoodEstimated Value: $240,000 - $257,258
2
Beds
3
Baths
1,240
Sq Ft
$202/Sq Ft
Est. Value
About This Home
This home is located at 5268 Bardith Cir, Virginia Beach, VA 23455 and is currently estimated at $250,815, approximately $202 per square foot. 5268 Bardith Cir is a home located in Virginia Beach City with nearby schools including Hermitage Elementary School, Independence Middle School, and Bayside High School.
Ownership History
Date
Name
Owned For
Owner Type
Purchase Details
Closed on
Jul 26, 2017
Sold by
Kane Michael R
Bought by
Weatherton Alexandra E
Current Estimated Value
Home Financials for this Owner
Home Financials are based on the most recent Mortgage that was taken out on this home.
Original Mortgage
$108,000
Outstanding Balance
$89,754
Interest Rate
3.9%
Mortgage Type
New Conventional
Estimated Equity
$161,061
Purchase Details
Closed on
Jun 17, 2014
Sold by
Lane Jessica W
Bought by
Kane Michael R
Home Financials for this Owner
Home Financials are based on the most recent Mortgage that was taken out on this home.
Original Mortgage
$132,692
Interest Rate
4.19%
Mortgage Type
VA
Purchase Details
Closed on
Apr 28, 1999
Sold by
Fowler Donald R
Bought by
Lane Jessica W
Home Financials for this Owner
Home Financials are based on the most recent Mortgage that was taken out on this home.
Original Mortgage
$83,100
Interest Rate
6.95%
Mortgage Type
VA
Create a Home Valuation Report for This Property
The Home Valuation Report is an in-depth analysis detailing your home's value as well as a comparison with similar homes in the area
Home Values in the Area
Average Home Value in this Area
Purchase History
| Date | Buyer | Sale Price | Title Company |
|---|---|---|---|
| Weatherton Alexandra E | $135,000 | Attorney | |
| Kane Michael R | $129,900 | -- | |
| Lane Jessica W | $81,500 | -- |
Source: Public Records
Mortgage History
| Date | Status | Borrower | Loan Amount |
|---|---|---|---|
| Open | Weatherton Alexandra E | $108,000 | |
| Previous Owner | Kane Michael R | $132,692 | |
| Previous Owner | Lane Jessica W | $83,100 |
Source: Public Records
Tax History Compared to Growth
Tax History
| Year | Tax Paid | Tax Assessment Tax Assessment Total Assessment is a certain percentage of the fair market value that is determined by local assessors to be the total taxable value of land and additions on the property. | Land | Improvement |
|---|---|---|---|---|
| 2025 | $1,910 | $211,300 | $72,000 | $139,300 |
| 2024 | $1,910 | $196,900 | $65,000 | $131,900 |
| 2023 | $1,846 | $186,500 | $58,000 | $128,500 |
| 2022 | $1,616 | $163,200 | $50,000 | $113,200 |
| 2021 | $1,435 | $144,900 | $46,000 | $98,900 |
| 2020 | $1,374 | $135,000 | $43,000 | $92,000 |
| 2019 | $1,308 | $129,200 | $41,600 | $87,600 |
| 2018 | $1,295 | $129,200 | $41,600 | $87,600 |
| 2017 | $1,295 | $129,200 | $41,600 | $87,600 |
| 2016 | $1,227 | $123,900 | $41,600 | $82,300 |
| 2015 | $1,266 | $127,900 | $42,400 | $85,500 |
| 2014 | $1,175 | $130,200 | $42,400 | $87,800 |
Source: Public Records
Map
Nearby Homes
- 1625 Lucia Ct
- 5028 Cullen Rd
- 1729 Greenhouse Rd
- 1924 Charla Lee Ln
- 1713 Keeling Rd
- 4777 Hermitage Rd
- 1680 Meredith Rd
- 5004 Savin Ct
- 5016 Madeira Rd
- 5113 S Lake Rd
- 1529 Eagleton Ln
- 5064 Finn Rd
- 1541 Winter Rd
- 1449 Lakeview Dr
- 1917 Jack Frost Rd
- 5248 Mile Course Walk
- 5017 Gatehouse Way
- 4780 Seal Dr
- 1609 Shenstone Ct
- 4716 Hook Ln
- 5268 Bardith Cir Unit 5268
- 5276 Bardith Cir
- 5264 Bardith Cir
- 5264 Bardith Cir Unit 5264
- 5272 Bardith Cir
- 5260 Bardith Cir
- 5256 Bardith Cir
- 5316 Bardith Cir
- 5312 Bardith Cir
- 5312 Bardith Cir Unit 5312
- 5252 Bardith Cir
- 5248 Bardith Cir
- 5248 Bardith Cir Unit 5248
- 5324 Bardith Cir
- 5320 Bardith Cir
- 5281 Bardith Cir
- 5273 Bardith Cir
- 5265 Bardith Cir
- 5289 Bardith Cir
- 5244 Bardith Cir