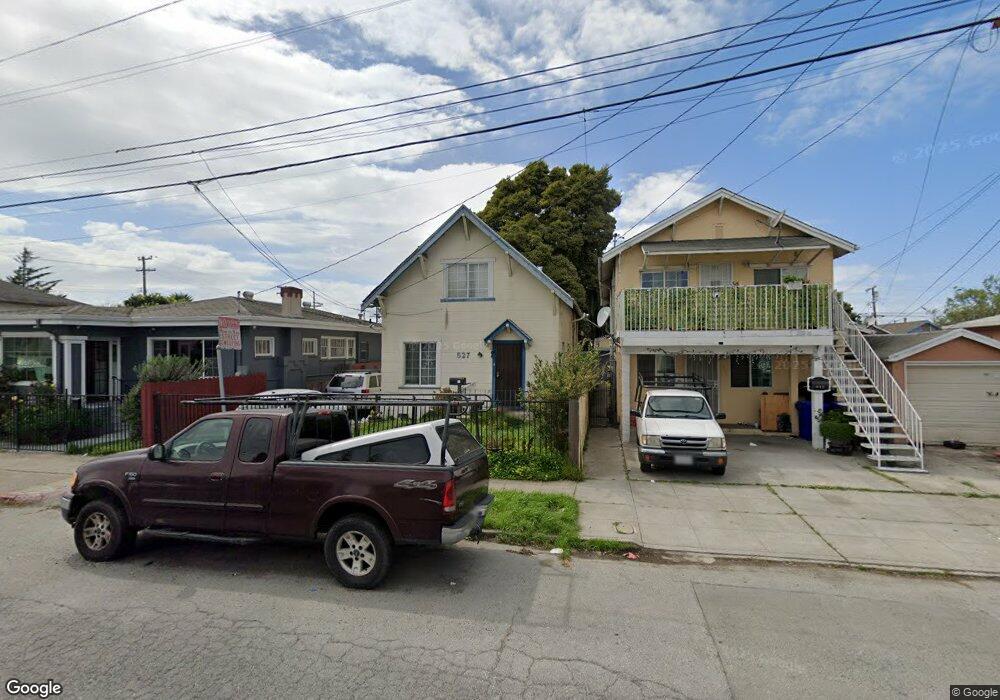
527 19th St Richmond, CA 94801
Belding Woods NeighborhoodEstimated Value: $540,523 - $624,000
3
Beds
1
Bath
1,401
Sq Ft
$423/Sq Ft
Est. Value
About This Home
This home is located at 527 19th St, Richmond, CA 94801 and is currently estimated at $592,631, approximately $423 per square foot. 527 19th St is a home located in Contra Costa County with nearby schools including Grant Elementary School, Lovonya DeJean Middle School, and John F. Kennedy High School.
Ownership History
Date
Name
Owned For
Owner Type
Purchase Details
Closed on
Oct 17, 2003
Sold by
Vazquez Jesus
Bought by
Vazquez Cristina
Current Estimated Value
Purchase Details
Closed on
Jul 7, 1995
Sold by
Ledesma Griselda M
Bought by
Vazquez Cristina and Vazquez Jesus
Home Financials for this Owner
Home Financials are based on the most recent Mortgage that was taken out on this home.
Original Mortgage
$119,376
Interest Rate
7.59%
Mortgage Type
FHA
Create a Home Valuation Report for This Property
The Home Valuation Report is an in-depth analysis detailing your home's value as well as a comparison with similar homes in the area
Home Values in the Area
Average Home Value in this Area
Purchase History
| Date | Buyer | Sale Price | Title Company |
|---|---|---|---|
| Vazquez Cristina | -- | North American Title | |
| Vazquez Cristina | $120,000 | North American Title Co |
Source: Public Records
Mortgage History
| Date | Status | Borrower | Loan Amount |
|---|---|---|---|
| Closed | Vazquez Cristina | $119,376 |
Source: Public Records
Tax History Compared to Growth
Tax History
| Year | Tax Paid | Tax Assessment Tax Assessment Total Assessment is a certain percentage of the fair market value that is determined by local assessors to be the total taxable value of land and additions on the property. | Land | Improvement |
|---|---|---|---|---|
| 2025 | $6,030 | $262,738 | $131,475 | $131,263 |
| 2024 | $5,974 | $257,588 | $128,898 | $128,690 |
| 2023 | $5,974 | $252,538 | $126,371 | $126,167 |
| 2022 | $5,827 | $247,588 | $123,894 | $123,694 |
| 2021 | $5,690 | $242,734 | $121,465 | $121,269 |
| 2019 | $4,616 | $235,536 | $117,863 | $117,673 |
| 2018 | $4,450 | $230,918 | $115,552 | $115,366 |
| 2017 | $5,498 | $226,391 | $113,287 | $113,104 |
| 2016 | $5,355 | $221,953 | $111,066 | $110,887 |
| 2015 | $5,307 | $218,620 | $109,398 | $109,222 |
| 2014 | $4,432 | $157,500 | $78,814 | $78,686 |
Source: Public Records
Map
Nearby Homes