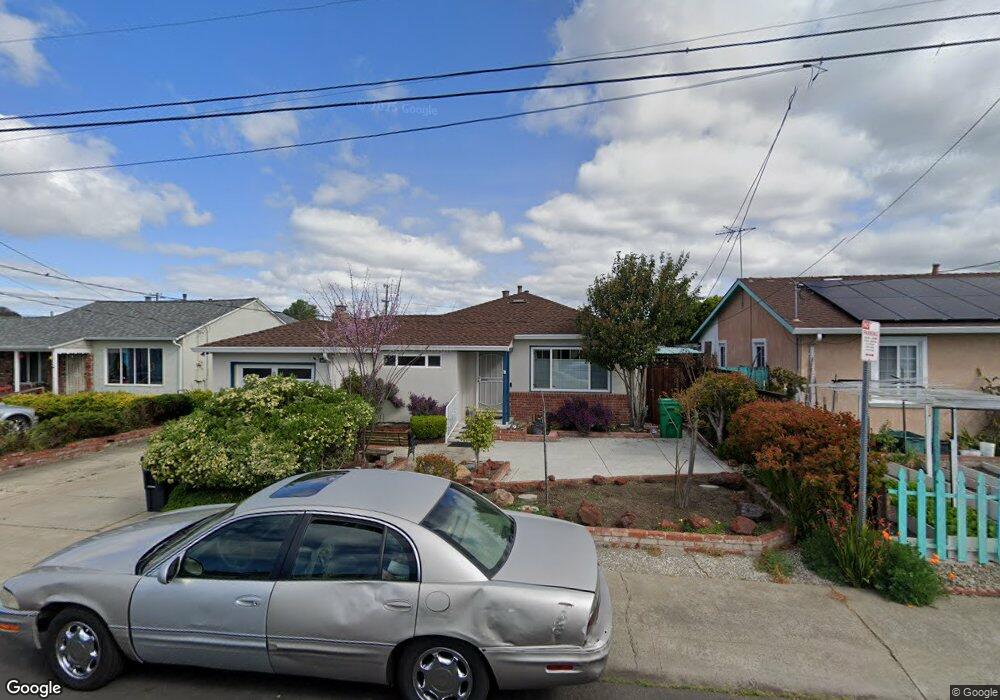
527 Doane St San Lorenzo, CA 94580
Estimated Value: $735,000 - $836,885
3
Beds
2
Baths
1,144
Sq Ft
$696/Sq Ft
Est. Value
About This Home
This home is located at 527 Doane St, San Lorenzo, CA 94580 and is currently estimated at $796,221, approximately $695 per square foot. 527 Doane St is a home located in Alameda County with nearby schools including Hesperian Elementary School, Edendale Middle, and San Lorenzo High School.
Ownership History
Date
Name
Owned For
Owner Type
Purchase Details
Closed on
Aug 1, 2018
Sold by
Coleman Erin Elaine and Coleman Jessica Martine
Bought by
Coleman Erin Elaine and Coleman Jessica Martine
Current Estimated Value
Home Financials for this Owner
Home Financials are based on the most recent Mortgage that was taken out on this home.
Original Mortgage
$584,000
Outstanding Balance
$507,180
Interest Rate
4.5%
Mortgage Type
New Conventional
Estimated Equity
$289,041
Purchase Details
Closed on
Dec 8, 2016
Sold by
Konopka Charles W and Konopka Emilie Ann
Bought by
Coleman Erin E and Ybarra Jessica M
Home Financials for this Owner
Home Financials are based on the most recent Mortgage that was taken out on this home.
Original Mortgage
$589,641
Interest Rate
4.12%
Mortgage Type
FHA
Purchase Details
Closed on
Apr 18, 2004
Sold by
Konopka Charles W and Konopka Emilie A
Bought by
Konopka Charles W and Konopka Emilie Ann
Create a Home Valuation Report for This Property
The Home Valuation Report is an in-depth analysis detailing your home's value as well as a comparison with similar homes in the area
Home Values in the Area
Average Home Value in this Area
Purchase History
| Date | Buyer | Sale Price | Title Company |
|---|---|---|---|
| Coleman Erin Elaine | -- | Chicago Title Company | |
| Coleman Erin E | $610,000 | Chicago Title Company | |
| Konopka Charles W | -- | -- |
Source: Public Records
Mortgage History
| Date | Status | Borrower | Loan Amount |
|---|---|---|---|
| Open | Coleman Erin Elaine | $584,000 | |
| Closed | Coleman Erin E | $589,641 |
Source: Public Records
Tax History Compared to Growth
Tax History
| Year | Tax Paid | Tax Assessment Tax Assessment Total Assessment is a certain percentage of the fair market value that is determined by local assessors to be the total taxable value of land and additions on the property. | Land | Improvement |
|---|---|---|---|---|
| 2025 | $9,035 | $707,941 | $212,382 | $495,559 |
| 2024 | $9,035 | $694,063 | $208,219 | $485,844 |
| 2023 | $8,984 | $680,454 | $204,136 | $476,318 |
| 2022 | $8,860 | $667,114 | $200,134 | $466,980 |
| 2021 | $8,623 | $654,035 | $196,210 | $457,825 |
| 2020 | $8,444 | $647,331 | $194,199 | $453,132 |
| 2019 | $8,465 | $634,643 | $190,393 | $444,250 |
| 2018 | $8,029 | $622,200 | $186,660 | $435,540 |
| 2017 | $7,661 | $610,000 | $183,000 | $427,000 |
| 2016 | $1,568 | $98,937 | $57,929 | $41,008 |
| 2015 | $1,530 | $97,451 | $57,059 | $40,392 |
| 2014 | $1,506 | $95,542 | $55,941 | $39,601 |
Source: Public Records
Map
Nearby Homes
- 14828 Martell Ave
- 710 Videll St
- 475 Nabor St
- 455 Lloyd Ave
- 15539 Usher St
- 15540 Hesperian Blvd
- 1112 Adason Dr
- 819 Delano St
- 1440 Thrush Ave Unit 48
- 15609 Ronda St
- 16006 E 14th St Unit 101
- 1525 Thrush Ave
- 391 Anza Way
- 920 Elgin St Unit G
- 1507 Green Ct
- 1540 Mono Ave
- 15009 Kesterson St
- 263 Ano Ave
- 15049 Kesterson St
- 619 Beatrice St