
Seller's Agent in 2026
Julie Dominique
Elias H. Frey & Sons, Inc.
(419) 572-1350
14 in this area
138 Total Sales

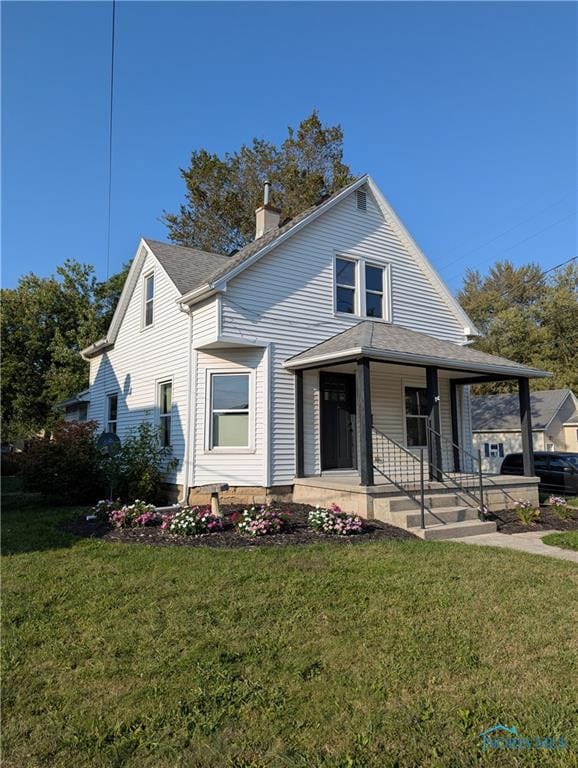
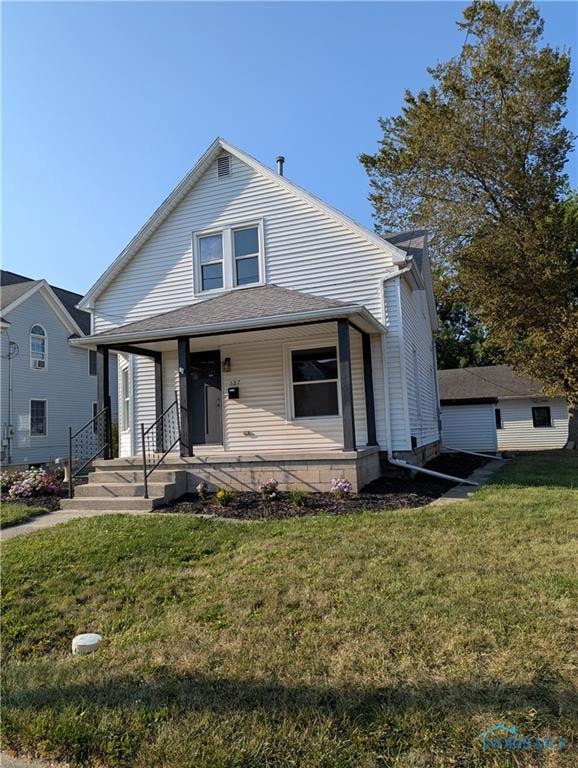
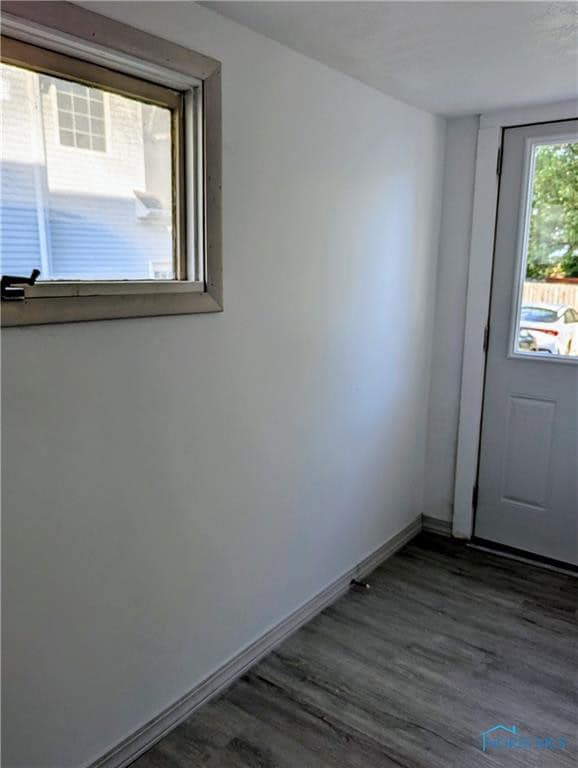
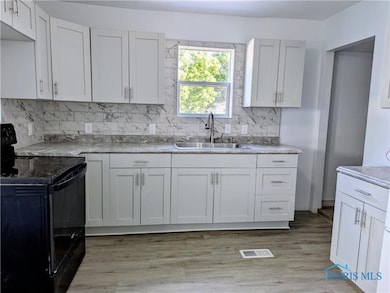
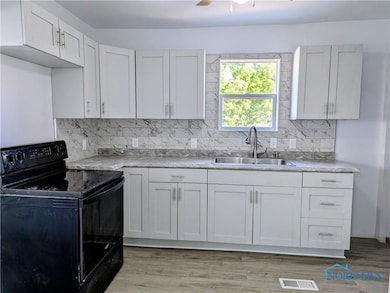
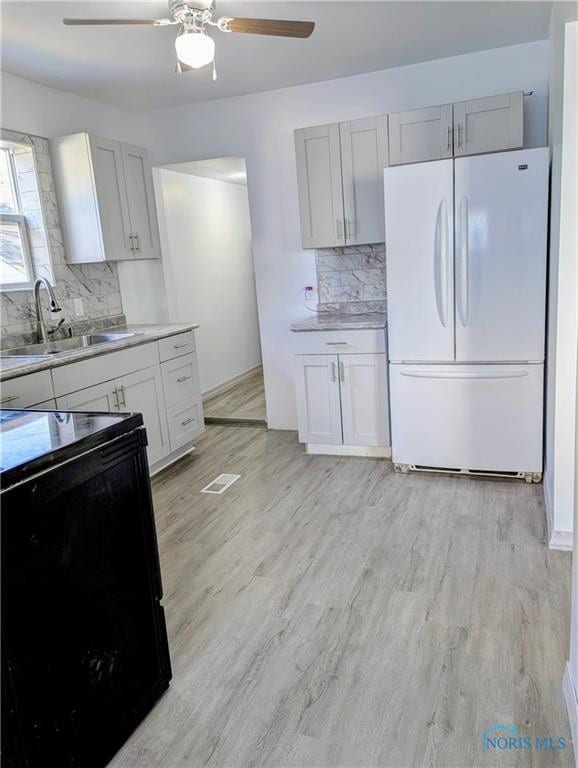
Welcome home! This 2-bedroom, 1 bath home boasts 1305 sq ft main floor laundry! Completely remodeled kitchen w/new cabinets, countertop and large new walk-in pantry. Nice freshly painted contemporary color scheme with original wood floors in dining and living room. Conveniently near downtown restaurants, public pool and Wauseon Schools. New carpeting upstairs, new breaker box, new rubber roof over kitchen. Detached 1 1/2 car garage with opener and updated wiring. So many updates to list. Don't miss this adorable property.
Last Agent to Sell the Property
Elias H. Frey & Sons, Inc. Brokerage Phone: 419-572-1350 License #2016004125 Listed on: 12/08/2025
| Date | Type | Sale Price | Title Company |
|---|---|---|---|
| Warranty Deed | $145,000 | None Listed On Document | |
| Quit Claim Deed | -- | None Listed On Document | |
| Interfamily Deed Transfer | -- | None Available | |
| Deed | $79,500 | -- | |
| Deed | $61,000 | -- | |
| Deed | -- | -- |
| Date | Status | Loan Amount | Loan Type |
|---|---|---|---|
| Open | $130,000 | New Conventional | |
| Previous Owner | $75,500 | New Conventional |
| Date | Event | Price | List to Sale | Price per Sq Ft |
|---|---|---|---|---|
| 02/09/2026 02/09/26 | Sold | $145,000 | -9.3% | $111 / Sq Ft |
| 12/01/2025 12/01/25 | Price Changed | $159,900 | -3.1% | $123 / Sq Ft |
| 10/04/2025 10/04/25 | For Sale | $165,000 | -- | $126 / Sq Ft |
| Year | Tax Paid | Tax Assessment Tax Assessment Total Assessment is a certain percentage of the fair market value that is determined by local assessors to be the total taxable value of land and additions on the property. | Land | Improvement |
|---|---|---|---|---|
| 2024 | $1,449 | $29,440 | $5,850 | $23,590 |
| 2023 | $1,496 | $29,440 | $5,850 | $23,590 |
| 2022 | $1,336 | $22,340 | $4,870 | $17,470 |
| 2021 | $1,397 | $22,340 | $4,870 | $17,470 |
| 2020 | $1,284 | $22,340 | $4,870 | $17,470 |
| 2019 | $1,197 | $20,520 | $4,870 | $15,650 |
| 2018 | $1,075 | $20,520 | $4,870 | $15,650 |
| 2017 | $1,063 | $20,520 | $4,870 | $15,650 |
| 2016 | $1,061 | $18,730 | $4,870 | $13,860 |
| 2015 | $993 | $18,730 | $4,870 | $13,860 |
| 2014 | $946 | $18,730 | $4,870 | $13,860 |
| 2013 | $1,107 | $20,310 | $4,380 | $15,930 |
Seller's Agent in 2026
Julie Dominique
Elias H. Frey & Sons, Inc.
(419) 572-1350
14 in this area
138 Total Sales
Buyer's Agent in 2026
Michael Tester
Howard Hanna
(419) 335-5170
34 in this area
69 Total Sales
Source: Northwest Ohio Real Estate Information Service (NORIS)
MLS Number: 6136019
APN: 06-009676-00.000
Disclaimer: Certain information contained herein is derived from information provided by parties other than Homes.com. All information provided is deemed reliable, but is not guaranteed to be accurate and should be independently verified.
![]() IDX information is provided exclusively for personal, non-commercial use, and may not be used for any purpose other than to identify prospective properties consumers may be interested in purchasing. Information is deemed reliable but not guaranteed. ©2026 NORIS. All rights reserved.
IDX information is provided exclusively for personal, non-commercial use, and may not be used for any purpose other than to identify prospective properties consumers may be interested in purchasing. Information is deemed reliable but not guaranteed. ©2026 NORIS. All rights reserved.
Ask me questions while you tour the home.